
Dernière mise à jour : 15 janvier 2021

Détails
État du projet:
Terminé
Gamme de produits:
Examen d’une technologie de la santé
Sous-type de projet :
Utilisation optimale
Numéro de projet :
OP0546-000
Final Biosimilar Summary Dossier Issued:
Abbreviations
| AI | artificial intelligence |
| CADTH | Canadian Agency for Drugs and Technologies in Health |
| CAR | Canadian Association of Radiologists |
| CCOHTA | Canadian Coordinating Office for Health Technology Assessment |
| CDST | clinical decision support tool |
| CIHI | Canadian Institute for Health Information |
| CMII | Canadian Medical Imaging Inventory |
| COCIR | European Coordination Committee of the Radiological, Electromedical and Healthcare IT Industry |
| CT | computed tomography |
| FTE | full-time equivalent |
| MRI | magnetic resonance imaging |
| MRT | medical radiation technologist |
| OECD | Organisation for Economic Co-operation and Development |
| PACS | picture archiving and communication system |
| PET | positron emission tomography |
| PET-CT | positron emission tomography–computed tomography |
| PET-MRI | positron emission tomography–magnetic resonance imaging |
| SPECT | single-photon emission computed tomography |
| SPECT-CT | single-photon emission computed tomography–computed tomography |
Key Messages
The Canadian Medical Imaging Inventory (CMII) documents current practices and developments in the supply, distribution, technical operations, and general clinical and research use of advanced imaging equipment across Canada. The report tracks where imaging capacity exists, exam volume, hours of operation, and types of use. Data are presented on human resources, funding structures, ordering and referral practices, and the adoption of tools that may support appropriate imaging, system efficiencies, and wait-list reductions. Comparisons with other countries are reported, as well as trends and projections on imaging capacity. This information may be used to inform capital planning and equipment replacement strategies, identify gaps in service, and anticipate future demand.
- CT is the most widely distributed advanced imaging modality across Canada (549 units), followed by MRI (378 units), single-photon emission computed tomography ( SPECT) (305 units), SPECT-CT (271 units), PET-CT (57 units), and PET-MRI (5 units).
- Regarding the total volume of exams, CT is the most-used modality (5.41 million exams per year), followed by MRI (2.33 million exams per year), SPECT and SPECT-CT combined (1.2 million exams per year), and PET-CT (125,775 exams per year). PET-MRI is used only for research purposes.
- Compared to other countries, Canada appears in the lower tertile for the number of units per million people for CT, MRI, and PET-CT, and below the median for the volume of CT, MRI, and PET-CT exams per thousand population.
- Approximately 60% of imaging equipment has been operating for 10 or fewer years (with some variance between modalities).
- The main drivers for decisions to replace existing equipment are equipment age, end of manufacturer support, and equipment failure.
- The most commonly used exam requisition method for all imaging modalities across Canada is paper and fax.
- While the adoption of picture archiving and communication systems (PACS) is extensive across Canada, not all sites are able to share images if they are on separate networks with different protocols.
- A process for determining the appropriateness of imaging exams is in place in 84% of imaging facilities. The most commonly used process to ensure the appropriateness of exams is radiologist review of referral.
- Artificial intelligence (AI) is used in at least 40 imaging departments for clinical and research purposes. While the use of AI varies across jurisdictions, it is used in all provinces. And AI is used for all imaging modalities, with most of its use in CT for image reconstruction, lowering radiation dose, and for reading and interpreting images.
Abstract
Background
Context and Policy Issues
The purpose of the CMII is to document current practices and developments in the supply, distribution, technical operations, and general clinical use of advanced imaging equipment across Canada. Medical imaging is a vital component of modern health care, playing a role in the diagnosis, staging, and monitoring of many diseases and conditions. As new medical imaging technologies become available and population needs change, it is important to keep track of where imaging capacity exists, how equipment is used, and the adoption of tools that may support appropriate imaging, system efficiencies, and wait-list reductions.
Methods
CADTH collected data on six advanced imaging modalities: CT, MRI, PET-CT, single-photon emission computed tomography (SPECT), SPECT-CT, and PET-MRI using a web-based survey and a search of the literature. The data were reviewed by validators for accuracy and validators provided additional information of provincial and regional policies and practices.
Summary of Evidence
Of the modalities surveyed, CT is the most widely distributed, with the highest number of units, followed by MRI. All provinces and territories have at least one CT unit; all provinces and Yukon have at least one MRI unit; and all provinces have at least one SPECT and/or SPECT-CT unit. None of the territories have SPECT or SPECT-CT. Nine provinces have PET-CT in clinical use. Two provinces, Alberta and Ontario, have PET-MRI that is used for research purposes.
Regarding the total volume of exams, CT is the most-used modality (5.41 million exams per year), followed by MRI (2.33 million exams per year), SPECT and SPECT-CT combined (1.2 million exams per year), and PET-CT (125,775 exams per year).
Each imaging modality, apart from SPECT, experienced growth in the last decade in Canada in the number of units and the number of units per million people. CT experienced the slowest growth rate of all imaging modalities — at a 1.4% increase in units per million people over the last decade — compared with other imaging modalities (MRI 20%; PET-CT 25%; and SPECT-CT 70%).
Over the last decade, the overall volume of exams increased by 32% and 62% for CT and MRI, respectively. Similarly, the number of exams per thousand population increased by 18% and 46%, respectively. Examination data for the other modalities were not available in 2010.
Conclusions and Implications for Decision or Policy-Making
The CMII data provides insight into the current context of medical imaging across Canada and raise questions related to how medical imaging is monitored and regulated, and how it is optimally used. As well, the data raise questions about how funding structures are organized, what the most cost-effective practices are, and whether access is equitable, especially in rural and remote areas. Overall, the findings of this report may help decision-makers identify gaps in service; inform medical imaging-related strategic planning on a national, provincial, or territorial basis; and help anticipate future growth and need for replacement. Additionally, the data can be used to identify system efficiencies and monitor the adoption of practices and tools that may support appropriate imaging and wait-list reductions.
Executive Summary
The purpose of this inventory is to document current practices and developments in the supply, distribution, technical operations, and general clinical use of advanced imaging equipment. This is the third iteration of the Canadian Medical Imaging Inventory (CMII) since CADTH resumed the collection of this data in 2015. Previously, the Canadian Institute for Health Information (CIHI) collected data on medical imaging technologies in Canada from 2003 to 2012.
Methods
Information was collected on six imaging modalities using a web-based survey, supplemented with information from provincial and territorial validators, report peer reviewers, and literature searches. The imaging modalities were:
- CT
- MRI
- single-photon emission computed tomography (SPECT)
- PET-CT
- PET-MRI
- SPECT-CT.
The survey opened on November 27, 2019, and data collection formally closed on February 11, 2020. Data from the previous iteration of the survey were saved, and respondents were invited to update the data associated with their sites or, if there was no pre-existing entry, to complete the survey. High-level data were reviewed by pre-identified regional and provincial validators, who supplied corrections and supplementary data, which were entered in the database. Identified stakeholders and survey respondents were given the opportunity to review the report during the stakeholder feedback process.
Results
Data from 455 sites were used to inform the findings of this report. Updated or new survey responses were received for at least 244 sites. Provincial and territorial validators provided some information for nonresponding publicly funded health facilities. The majority of sites were publicly funded. Seventy-three percent of sites were urban, 24% were rural, and 2% were remote.
Computed Tomography
- A total of 549 CT units were identified in Canada, up from 484 in 2010. All provinces or territories had at least one unit. Ontario and Quebec had the most units, followed by British Columbia and Alberta. The three northern territories had one unit each.
- An estimated 5,419,821 CT examinations were performed in the most recent fiscal year in Canada, up from 4,122,158 in 2010. This is equivalent to 143.4 exams per thousand people, up from 121.9 in 2010.
- In the next 20 years, the volume of CT exams is anticipated to increase by 18%, based on population projections and current use.
- CT units operate for an average of 80.5 hours per week and 12.6 hours per day. Most operate on weekends. CT is used across disciplines, with approximately one-quarter of the time used in the field of oncology, followed by neurology, hepatobiliary exams, and respiratory exams.
- When the number of CT units per population for Canada is compared with that in other countries that report CT units to the Organisation for Economic Co-operation and Development (OECD), Canada appears in the lower quarter of the reported numbers. For the number of exams per population, Canada appears around the midpoint.
- Referring physicians use clinical decision support tools (CDSTs) for 61% of CT exams ordered at the point of care.
- One-third of CT units are five years old or less, 28% are six to 10 years old, 27% are 11 to 15 years old, and 5% are 16 to 20 years old.
- Almost half of CT units have 64 cross-sectional images or slices, and about one-quarter have 128 slices. More than three-quarters of CT units incorporate image reconstruction techniques for dose reduction, 88% are equipped with dose-management controls, and 95% record dose by exam.
Magnetic Resonance Imaging
- A total of 378 MRI units were identified in Canada, up from 281 in 2010. All provinces and one territory have at least one unit. Ontario and Quebec have the most units, followed by British Columbia and Alberta. Yukon and Prince Edward Island have single units.
- An estimated 2,330,223 MRI examinations were performed in the most recent fiscal year in Canada, up from 1,434,499 in 2010. This is equivalent to 61.6 exams per thousand people, up from 42.4 per thousand people in 2010.
- In the next 20 years, the volume of MRI exams is anticipated to increase by 20%, based on population projections and current use.
- MRI units operate for an average of 87.8 hours per week and 14.1 hours per day. More than half operate on weekends. MRI is used across disciplines, with half of all use split between neurology and musculoskeletal exams, followed by oncology and hepatobiliary exams.
- When the number of MRI units per population for Canada is compared with that in other countries that report MRI units to the OECD, Canada appears in the lower third of the reported numbers. For the number of exams per population, Canada appears around the midpoint.
- Referring physicians use CDSTs for 18% of MRI exams ordered at the point of care.
- Less than one-third of MRI units are five years old or less, 26% are six to 10 years old, 26% are 11 to 15 years old, and 10% are 16 to 20 years old.
- The majority (80%) of MRIs have field strengths of 1.5 tesla.
Positron Emission Tomography–Computed Tomography or Positron Emission Tomography
- A total of 57 PET-CT units were identified in Canada, up from 40 in 2010. Nine provinces have at least one unit. Ontario and Quebec have the most units.
- An estimated 125,775 PET-CT examinations were performed in the most recent fiscal year in Canada. This is equivalent to 3.4 exams per thousand people.
- In the next 20 years, the volume of PET-CT exams is anticipated to increase by 16%, based on population projections and current use.
- PET-CT units operate for an average of 43.4 hours per week and 9.0 hours per day. Most PET-CT units do not operate on weekends. PET-CT is primarily used for oncology exams (79%), followed by cardiac and neurological use.
- When the number of PET-CT units per population for Canada is compared with that in other countries that report PET-CT units to the OECD, Canada appears in the lower third of the reported numbers. For the number of exams per population, Canada appears below the midpoint.
- Referring physicians use CDSTs for 26% of PET-CT exams ordered at the point of care.
- Almost one-quarter of PET-CT units are five years old or less, 28% are six to 10 years old, and 33% are 11 to 15 years old.
- Half of PET-CT units have 16 slices. The majority of units (90%) are equipped with dose-management controls, and 86% record patient radiation dose by exam.
- The most commonly used isotopes for oncology are fluorine-18–fluorodeoxyglucose (18F-FDG), followed by fluorine-18–sodium fluoride (18F-NaF).
- One-third of sites with PET-CT units have access to a local cyclotron to generate radioisotopes.
Positron Emission Tomography–Magnetic Resonance Imaging
- A total of five PET-MRI units were identified in Canada. Four are located in Ontario, and one unit is in Alberta.
- As PET-MRI is used for research purposes only, we do not have data on clinical examinations or use.
Single-Photon Emission Computed Tomography
- A total of 305 SPECT units were identified in Canada, down from 618 (including gamma cameras) in 2010. Nine provinces have at least one unit. Ontario and Quebec have the most units, followed by Alberta and British Columbia.
- Individual data for SPECT exams were not available for all provinces, so the combined exams are reported under SPECT-CT. Exam data for 2010 were not available.
- SPECT units operate for an average of 43.8 hours per week and 8.9 hours per day. A minority of units operate on weekends. SPECT is primarily used for cardiac examinations (36%), followed by oncology and musculoskeletal exams.
- Most referring physicians do not use CDSTs for SPECT exams ordered at the point of care.
- One-third of SPECT units are 11 to 15 years old, 28% are 16 to 20 years old, 17% are six to 10 years old, and 5% are five years old or less.
- Three-quarters of units have two detector heads, and one-quarter are dedicated cardiac units.
Single-Photon Emission Computed Tomography–Computed Tomography
- A total of 271 SPECT-CT units were identified in Canada, up from 98 in 2010. Ten provinces have at least one unit. Ontario and Quebec have the most units, followed by Alberta and British Columbia.
- A total of 1.2 million SPECT or SPECT-CT exams were carried out in Canada.
- In the next 20 years, the volume of SPECT and SPECT-CT exams is anticipated to increase by 13% based population projections and current use.
- SPECT-CT units operate for an average of 45.6 hours per week and 9.0 hours per day at responding sites. A minority of units operate on weekends. SPECT-CT is primarily used for cardiac examinations (33%), followed by musculoskeletal and oncology exams.
- Most referring physicians do not use CDSTs for SPECT-CT exams ordered at the point of care.
- Almost half of SPECT-CT units are five years old or less, 25% are six to 10 years old, and 24% are 11 to 15 years old.
- Almost all units have two detector heads, two-thirds are equipped with dose-management controls and 67% recorded patient radiation dose by exam. More than two-thirds incorporated image reconstruction techniques for dose reduction.
Picture Archiving and Communication Systems
- Almost one-third (30%) of sites had access to a local or institutional picture archiving and communication system (PACS) network, 30% had access to a regional network, and one-third (39%) had access to a provincial network.
- Almost all sites allow access to PACS images outside the imaging department, and two-thirds allow access to other sites within the provincial health care system.
- Sites with PACS that are geographically close may not necessarily be able to share images, if they are on separate networks with different protocols.
Appropriate Imaging
- Most imaging facilities (84%) have processes in place to determine the appropriateness of orders. Radiologist review of exam orders is the most commonly adopted process.
Limitations
- For feasibility, this iteration of the survey was restricted to six specialist imaging modalities and does not include others that are more common and widespread (e.g., conventional X-ray radiography and ultrasonography).
- As we do not have a definitive list of facilities containing the equipment, and, as the survey was voluntary, we cannot ensure that all facilities or departments containing the modalities were contacted or represented.
- For some survey questions, data were available for only a limited number of sites.
Introduction
In Canada, medical imaging is a vital service within our health care system. It is at the heart of medical practice1 and has transformed the delivery of health care by facilitating the early detection of disease and improving patient outcomes.2,3 Medical imaging has shifted from the study of anatomy alone to the examination of both anatomy and physiology. Information from medical imaging is needed for both acute and non-urgent care, as well as for inpatient and outpatient services.4
CT, MRI, and nuclear medicine imaging, including single-photon emission computed tomography (SPECT) and positron emission tomography (PET), have become commonplace in medical imaging and nuclear medicine departments across Canada. In recent years, hybrid technologies, such as SPECT-CT, PET-CT, and PET-MRI, have further expanded the imaging repertoire. Other recent innovations include techniques that provide higher-quality imaging, lower radiation doses, and faster examinations.5,6
Collectively, these advanced imaging modalities are a significant contributor to the growth in health care costs.7 At the same time, because the rapid diagnosis of patients can reduce further testing and is a step closer to treatment,8 advanced imaging equipment is ultimately associated with decreased long-term health care costs.8 Nonetheless, advanced imaging equipment is expensive,9 especially when considering infrastructure, installation, operating, and ongoing maintenance costs, and, as a result, it often receives special scrutiny.4
As imaging modalities advance, decision-makers and clinicians face complex choices about which medical imaging technologies to acquire and use. Each modality offers unique characteristics, advantages, and disadvantages. However, decisions about adoption and implementation are made within the context of a finite health care budget and limited availability of clinical and technical expertise. In addition, the need for appropriate use of imaging studies has been highlighted by Choosing Wisely Canada10 and Canada Safe Imaging.11 Overuse is associated with unnecessary exposure to radiation, risks of further investigation and treatment arising from false-positive or incidental findings,12 and increased wait times for necessary procedures.13 Wait times can be linked to poorer patient outcomes and may result in reversible conditions worsening, to become chronic, irreversible conditions or permanent disability.14 As well, excessive wait times for CT and MRI are associated with a significant economic burden.15
Coronavirus disease (COVID-19) has exacerbated imaging exam wait times because nonurgent imaging services were postponed during the lockdown in March–April 2020, as a measure to prevent the further spread of COVID-19 and to preserve health system capacity.16 During this period, radiology services experienced a 50% to 70% reduction in volume. While services resumed later in 2020, radiology departments across Canada are challenged with managing a backlog of exams and introducing additional precautions against infection that reduce capacity.16 The survey data captured in this report were collected before the outbreak of COVID-19 and reflect advanced medical imaging in a pre-pandemic environment.
Given these considerations, current information regarding the status of medical imaging equipment in Canada is critical. In 2001, CADTH (then the Canadian Coordinating Office for Health Technology Assessment, CCOHTA) conducted its first inventory of diagnostic imaging equipment in Canada. From 2003 to 2012, CIHI continued to collect data on the inventory and use of diagnostic imaging equipment.17-19 In 2015, CADTH resumed work on the inventory to meet the ongoing need, producing its first report in 201620 and its second report in 2018.21 This updated CMII report summarizes the findings of the 2019–2020 iteration of the inventory.
For this iteration, data were collected on six modalities: CT, MRI, SPECT, PET-CT (which has almost entirely superseded PET), PET-MRI, and SPECT-CT (Appendix 1 describes the modalities and their use.) These six were given priority over several modalities captured in previous iterations of the survey (angiography units, cardiac catheterization units, bone densitometers, and lithotripsy imaging)17-19 and over the widely used modalities of conventional X-ray radiography and ultrasonography. It is considered particularly challenging to collect data on both of these modalities because many exams are performed with hand-held or mobile units. We limited the scope to ensure feasibility, guided by stakeholder prioritization of these six modalities; however, the scope will be re-assessed and expanded in future iterations, if feasible. Data were also captured on infrastructure requirements of current concern:
- use of and access to a PACS for each of the six modalities
- adoption of artificial intelligence (AI)
- requisition practices of referring physicians
- source and use of various isotopes for PET and its hybrid modalities.
Objectives
The purpose of this pan-Canadian inventory is to document current practices and developments in the supply, distribution, technical operation, and general clinical use of selected medical imaging modalities at public and private Canadian health care facilities. The overall objectives of the project are the following:
- to determine the number of units (medical imaging devices) for selected medical imaging modalities in Canada
- to provide accurate and timely data on the supply, distribution, and use of selected medical imaging units in Canada
- to improve current understanding of the technical characteristics of medical imaging equipment in Canada
- to report on trends and developments in the use of medical imaging equipment across Canada
- to inform medical imaging–related strategic planning on a national, provincial, or territorial basis.
Methods
Identification of Respondents and Data Collection
Data Sources
Data were primarily collected via a web-based survey on the CADTH website. (The English-language survey is shown in Appendix 2.) Both English- and French-language versions were offered. The 2019–2020 survey was based on the 2017 iteration of the survey, with the following changes:
- Questions added
- the estimated percentage of operational revenue sourced from private insurers or out-of-pocket patient payments for facilities that were privately funded or received a mix of private and public funding (not applicable for public sites)
- whether a unit was a replacement for a decommissioned unit or a first-time installation for the site
- the number of cone beam CT units
- whether patient cumulative radiation dose tracking is used for CT, PET-CT, and SPECT-CT units; if not, whether patient cumulative radiation tracking is planned for the future
- scheduled downtime of imaging modalities for maintenance and unplanned maintenance time, in hours per year
- the number of full-time imaging medical radiation technologists (MRTs) in radiology departments
- breakdown of use among diagnostic, interventional, research, and other purposes in percentages of time for imaging units by modality type
- whether AI, electronic CDSTs, peer review programs, centralized order entry systems, and automated entry forms have been adopted for imaging units
- whether paper forms are used when ordering exams for imaging units; whether exam requests are sent by fax or by telephone
- the type of equipment servicing options for imaging units
- breakdown of the type and use of PET radiotracers
- breakdown of the types of processes used to determine the appropriateness of exams.
Survey respondents who had participated in previous iterations of the inventory were presented with pre-populated forms for updating and completion. Respondents for new sites were identified by validators and other imaging professionals and were provided with blank forms. Data for pre-population were obtained from the following sources:
- site-level data from the CMII 2017 survey, including site survey responses, supplemented by data validators, and a supplementary grey literature search conducted for the 2017 report
- unit-level (technical) data from the CMII 2017 survey, for units installed between 2012 and 2017
- unit-level data from the CIHI 2012 dataset, for units installed before 2012; site-level data were not carried forward
- unit-level availability data provided by three major suppliers of diagnostic imaging equipment (Toshiba, Siemens, and GE) in 2017.
The CMII 2017 final dataset was restructured and merged with the new data. Differences in site names, unit technical specifications, and dates of installation were reconciled manually across data sources. Site names, year of decommission, and first year of operation of imaging equipment, in particular, were inconsistent across sources. Sites with name changes were updated and verified via web searches and/or by contacting the facility directly. If the data source offered a year of installation but did not indicate the first year of operation, then the first year of operation was assumed to be the year following installation.
Site-level data consisted of unit availability and counts by modality, and the following metrics by modality:
- total number of exams in the last fiscal year across all units (some sites had only the last calendar year available, and reported that)
- use of AI
- CDST
- planned and unplanned downtime for maintenance
- use of paper forms or telephone requests or fax requests
- numbers of full-time equivalent technologists (collectively for units of the same type).
Site-level data also included the type of facility, the use of PACS, and proportions of private funding. Unit-level information consisted of manufacturer, model, and year of installation, as well as modality-specific technical characteristics, such as the average hours of use per day and per week through regular scheduled service capacity, 24-hour and weekend use, equipment downtime, the source of isotopes (for PET-CT or PET-MRI), number of detectors/slices for CT, field strength for MRI, breakdowns of types of use into categories, the integration of AI, peer review programs, order entry practices, and equipment servicing arrangements.
Survey respondents for 2019–2020 were asked to update the available data to reflect the status as of the time of survey response. In particular, survey respondents were asked to identify units that had been decommissioned, regardless of the year, and to provide the year of decommissioning. If survey respondents did not update the survey, it was assumed that no changes had been made from the 2017 survey. This assumption was specifically mentioned to survey respondents when the final survey reminder was sent to facilities that had not already submitted the survey. The survey form also included a field to invite respondents to give additional detail, from which we extracted information regarding decommissioning activities, discrepancies between planned and unplanned downtime of equipment, descriptions of AI use, PET-CT information on cyclotrons and radiotracers, and sharing of mobile units.
Data from validators for unit counts and examinations in the last fiscal year were preferentially used over survey data; validator data were also used to calculate unit counts per population and exams per population. Data from 2017 were used for the number of units and exams when provincial validated data were not available. For equipment dates, validators sometimes reported slightly different periods than those documented in this report (2019–2020). This often depended on the availability of regional or provincial level data at the time of reporting or for specific reporting periods. Site-level unit counts supplied by validators were used to identify missing or surplus units in the database (duplicates or decommissioned units that had not been identified as such, the assumption being that the oldest unit or units were the ones decommissioned). In some instances, validators updated some site-level data up until October 28, 2020. Validators were also requested to identify the following:
- which health care professionals can order imaging exams for each of the different imaging modalities
- sources of funding
- drivers of jurisdictional decisions around replacing, upgrading, or adding new imaging equipment
- criteria used when expanding imaging modalities into new geographic locations
- the approximate length of time it takes to review proposals for new equipment in sites
- the percentage of exams conducted in the private setting
- whether teleradiology services were used.
In some instances, validators also updated this provincial and or regional data up until October 28, 2020.
Identification of Potential Respondents
Most respondents were identified in advance from a database of previous participants. These contacts were updated to account for changes due to position turnover, retirement, and restructuring. Potential respondents included individuals working in private or public health care settings that operate medical imaging equipment. Occupations included executive (e.g., president of a private facility, hospital administrator) and leadership positions (e.g., chief technologist, manager or director of diagnostic imaging, site coordinator). Some respondents were identified through CADTH liaison officers, external stakeholders, and participant referrals. Respondents for new private facilities were identified by cross-referencing provincial documents, conducting web searches, and contacting facilities directly.
Passive methods of recruitment included promoting the renewed survey on the CADTH website and by word of mouth. As well, several associations such as the Canadian Association of Radiologists (CAR), the Canadian Association of Medical Radiation Technologists, and the Canadian Organization of Medical Physicists promoted the survey via outreach to their membership and/or mention in newsletters.
To access the survey, all participants were asked to register a profile on the CADTH website to ensure their response was linked to a unique registration profile. Registrants were matched to sites if there was a pre-existing record, or, if there was no pre-existing record, were presented with a blank form to create a new record.
Duration of Survey
The survey opened on November 27, 2019, and data collection closed on February 11, 2020. In some instances, validators updated some site-level data, as well as provincial and/or regional level data, up until October 28, 2020.
Validation
When the survey closed on February 11, 2020, we created summary statistics of the number of units per modality in each jurisdiction. The summary statistics were reviewed by identified validators. Depending on the jurisdiction, each validator reviewed data for an entire province or territory, or for one or more health regions within a province. Validators assessed the summaries for accuracy and provided corrections and information on non-respondents (unit counts or examinations, either at a site or jurisdictional level). Validators were also asked to encourage non-respondents in their regions to participate in the survey by the extended deadline of February 14, 2020.
Validators also provided unit counts and examination volume data for their jurisdiction (province or region). Validators were also given an early draft of the report to confirm the main findings. In some instances, validators adjusted site-level data.
Identified stakeholders and validators were given the opportunity to review a draft report during a stakeholder feedback process. The report underwent two rounds of internal review and a formal peer review process before it was published.
Data Analysis
Data sources used in the CMII other than the survey and validator responses are presented in Table 1, and use of the datasets in the analysis, in Table 2.
Table 1: Additional Data Sources Used in the CMII
| Data source | Application of data |
|---|---|
| Industry data | From GE, Siemens, and Toshiba, we obtained a list of installed equipment and upgrades. |
| Canadian population data and projections | From Statistics Canada, we obtained population data and projections for Canada and the provinces. |
| International comparison data | From the OECD website, we obtained international comparison data for the number of units and examinations for CT, MRI, and PET. |
CT = computed tomography; MRI = magnetic resonance imaging; OECD = Organisation for Economic Co-operation and Development;
PET = positron emission tomography.
Table 2: Use of Datasets in Analyses
| Data summaries | Data sources | ||||||
|---|---|---|---|---|---|---|---|
| CMII 2019–2020 survey | CMII 2017 survey |
CMII 2015 surveya,b | CIHI 2012 datac | Validation data | Statistics Canada | International datad | |
| Summaries of site characteristics |
⦿ |
⦿ |
⦿ |
|
|
|
|
| Summaries of modality availability, number of units |
⦿ |
⦿ |
⦿ |
|
⦿ |
|
|
| Summary of planned installations and planned decommissioning |
⦿ |
⦿ |
|
|
|
|
|
| Summary of units at sites that had responses to the 2015 survey but no responses or validation data for the CMII 2017 surveya |
|
|
⦿ |
|
|
|
|
| Maps of machine locations |
⦿ |
⦿ |
⦿ |
|
⦿ |
|
|
| Summaries of exams in one fiscal year |
⦿ |
⦿ |
⦿ |
|
⦿ |
|
|
| Summaries of average hours per week and hours per day of operation, summaries of proportions of types of use |
⦿ |
⦿ |
⦿ |
|
|
|
|
| Summaries of units per site and units per population |
⦿ |
⦿ |
⦿ |
|
⦿ |
⦿ |
|
| Comparisons of inventory with international availability for CT, MRI, and PET-CT |
⦿ |
⦿ |
⦿ |
|
⦿ |
|
⦿ |
| Age of units, current and decommissioned |
⦿ |
⦿ |
⦿ |
⦿ |
|
|
|
| Technical specifications of current units |
⦿ |
⦿ |
⦿ |
⦿ |
|
|
|
CADTH = Canadian Agency for Drugs and Technologies in Health; CIHI = Canadian Institute for Health Information; CMII = Canadian Medical Imaging Inventory;
CT = computed tomography; MRI = magnetic resonance imaging.
a Sites that had a response to the 2015 survey, but not the 2017 survey, identified by the lack of a submission form for the 2017 survey or of correspondence indicating no change or describing changes.
b These data included responses from site survey responses, supplemented by data validators, and a supplementary grey literature search conducted for the 2015 report.
c From the dataset originally supplied to CADTH by the Canadian Institute for Health Information, consisting of data collected between 2003 and 2012, as described in the 2015 CMII report.11
d International data from the OECD.12-15
Data Summaries
We present the data using descriptive summaries and graphs of site- and province-level findings. We use counts for discrete data, such as the number of sites with a given modality or the number of units at a site. Continuous values are presented either as summary statistics such as mean (average), or range between minimum and maximum values, or as assigned categories (e.g., hours of use per day as less than eight hours, eight to less than 12 hours, 12 to less than 18 hours, and 18 hours or more). Where we asked respondents to choose between two or more responses (e.g., yes/no), we report the counts and/or percentages of respondents who selected each response. Stacked bar charts were used to display number of units and hours and percentage of use as categories. The geographical distribution of modalities was presented on maps using geocoded data.
International Comparison
The total or per capita number of units and exams of three imaging modalities — CT, MRI, and PET — from OECD countries22 was plotted, together with the data from the CMII 2020 survey, in diverging dot plots, with the values from the most recent years labelled. To demonstrate the time trends in the OECD countries, historical values were also plotted with dots in lighter shades. Canada’s ranking among OECD countries was reported.
Future Projections of the Numbers of Units and Exams for Canadian Provinces and Territories
The number of units and exams was projected for the years 2025, 2030, 2035, and 2040, based on the per capita values in 2020 and the projected population sizes provided by Statistics Canada. Projected population sizes were based on high-, median-, and low-growth assumptions. Median units and exams were projected based on median growth, and upper and lower limits were based on the high- and low-growth assumptions. The number of units and exams per capita was assumed to remain the same in 2025, 2030, 2035, and 2040.15 The projections are based on jurisdiction-wide population data and did not reflect projected growth in specific areas within a jurisdiction. This simplified assumption was similar to the one made by the Conference Board of Canada.15
Missing Data and Imputation
Handling of Data from Sites Without Updated Data in 2019–2020
If the 2019–2020 survey was not updated for a site, we assumed there was no change from 2017 data. We carried forward data from previous surveys according to the following rules:
- Data for site characteristics, PACS use, unit and modality availability, exam counts, technical information, and use collected during the CMII 2017 survey were carried forward unchanged.
- Data for unit technical specifications collected up to 2012 were used in data summaries for age and technical information, provided the unit had not been identified as surplus to validated counts.
- Data for site characteristics, PACS use, unit and modality availability and counts, and modality use collected up to 2012 were not incorporated into data summaries unless they were confirmed in 2015, 2017, or 2019 (e.g., for unit counts, by comparing with validators’ data).
Imputing Missing Data
We imputed data for a limited number of missing values. In particular, if the questions regarding planned installations or decommissioning were left blank, we assumed the answer was “no.” If the completed use categories added up to 100%, then any missing values were assumed to be 0%. Out-of-range values for the number of hours of operation per week (> 168 hours) or per day (> 24 hours) were set to “missing.”
Results
Response Rate for the 2019–2020 Update
Overall, data from 455 sites were used to inform the findings of this report. Updated or new survey responses were received for at least 244 sites. Provincial and territorial validators provided information for nonresponding publicly funded health facilities. Data obtained from the 2017 CMII survey and from other sources, such as information received via personal communications or from the websites of health care facilities, were used to inform the status of the remaining sites. At least minimal data (modalities and unit counts) were available for a total of 455 sites. By comparison, 222 and 370 completed initial surveys were received for the 2015 and 2017 CMII, respectively.
Characteristics of Facilities Responding to the 2019–2020 Update
Of the 401 sites with known facility type, most were identified as hospitals, accounting for 222 (55.2%) of reported sites, while 57 (14.2%) were community hospitals, 92 (22.9%) were free-standing facilities, and 31 (8.2%) were tertiary care centres. (Table 83, shows summaries by province or territory.) A facility was defined as a single hospital or hospital campus site that was part of an amalgamation of hospitals. The definition of free-standing facility was broad and captured mainly privately funded facilities and some publicly funded sites, as well as sites that received both types of funding. See Appendix 2 for the detailed definitions of facility type.
Of the 361 sites that provided setting information, most (264 [73.1%]) were urban, while 87 (24.1%) were rural, and 10 (2.8%) were remote. (Table 84, shows summaries by province or territory.)
Of the 401 sites that provided funding information, most (309 [77.1%]) were publicly funded, while 77 (19.2%) were privately funded, and 15 (3.7%) received both public and private funding (Table 85 shows summaries by province or territory).
Overall Inventory of Medical Imaging Equipment in Canada in 2019–2020
In this section, we briefly describe the overall reported inventory of units and use for the six imaging modalities of interest across all provinces and territories. Subsequent sections present in greater detail the inventory and use for CT, MRI, PET-CT, PET-MRI, SPECT, and SPECT-CT.
Total Unit Count
Figure 1 and Table 3 show the overall provincial and territorial inventory of all six modalities.
Table 3 shows the total number of units per modality for each jurisdiction, as well as the number of sites where that modality is available. This information is drawn from the survey responses, validators’ counts, and additional units identified in the CIHI 2012 survey data as free-standing facilities. The five PET-MRI units in Alberta and Ontario are used for research purposes only.
Table 3: Overall Provincial or Territorial Inventory and Availability of CT, MRI, PET-CT, PET-MRI, SPECT, and SPECT-CT for Public and Private Facilities in 2019–2020
| CT | MRI | PET-CT | PET-MRIa | SPECT | SPECT-CT | |
|---|---|---|---|---|---|---|
| Number of unitsb(number of sites with units)c | ||||||
| Alberta | 55 (43) | 44 (34) | 4 (3) | 1 (1) | 37 (25) | 38 (24) |
| British Columbia | 69 (46) | 52 (45) | 4 (3) | 0 (0) | 24 (19) | 30 (19) |
| Manitoba | 22 (16) | 14 (8) | 1 (1) | 0 (0) | 6 (4) | 8 (4) |
| New Brunswick | 17 (11) | 14 (10) | 2 (2) | 0 (0) | 11 (5) | 5 (5) |
| Newfoundland and Labrador | 15 (14) | 5 (5) | 1 (1) | 0 (0) | 3 (3) | 9 (4) |
| Northwest Territories | 1 (1) | 0 (0) | 0 (0) | 0 (0) | 0 (0) | 0 (0) |
| Nova Scotia | 17 (14) | 11 (10) | 1 (1) | 0 (0) | 7 (7) | 10 (8) |
| Nunavut | 1 (1) | 0 (0) | 0 (0) | 0 (0) | 0 (0) | 0 (0) |
| Ontario | 169 (107) | 124 (75) | 20 (16) | 4 (4) | 135 (68) | 85 (50) |
| Prince Edward Island | 2 (2) | 1 (1) | 0 (0) | 0 (0) | 0 (0) | 2 (1) |
| Quebec | 164 (100) | 102 (91) | 23 (18) | 0 (0) | 75 (38)d | 76 (40)d |
| Saskatchewan | 16 (13) | 10 (8) | 1 (1) | 0 (0) | 7 (4) | 8 (5) |
| Yukon | 1 (1) | 1 (1) | 0 (0) | 0 (0) | 0 (0) | 0 (0) |
| Canada | 549 (369) | 378 (288) | 57 (46) | 5 (5) | 305 (174) | 271 (160) |
CT = computed tomography; MRI = magnetic resonance imaging; PET = positron emission tomography; PET-CT = positron emission tomography–computed tomography; PET-MRI = positron emission tomography–magnetic resonance imaging; SPECT = single-photon emission computed tomography; SPECT-CT = single-photon emission computed tomography–computed tomography.
a PET-MRI is used only for research purposes.
b Per-province unit counts according to the validator and responses from private sites.
c Per-province unit availability according to the validator if the validator provided lists of sites with availability; where these were unavailable, the data were from the survey.
d Validator-supplied combined unit counts for SPECT and SPECT-CT. Distribution was assumed to be approximately 50:50, based on the division in Quebec and overall.
Figure 1: Overall Provincial or Territorial Inventory of CT, MRI, PET or PET-CT, PET-MRI, SPECT, and SPECT-CT
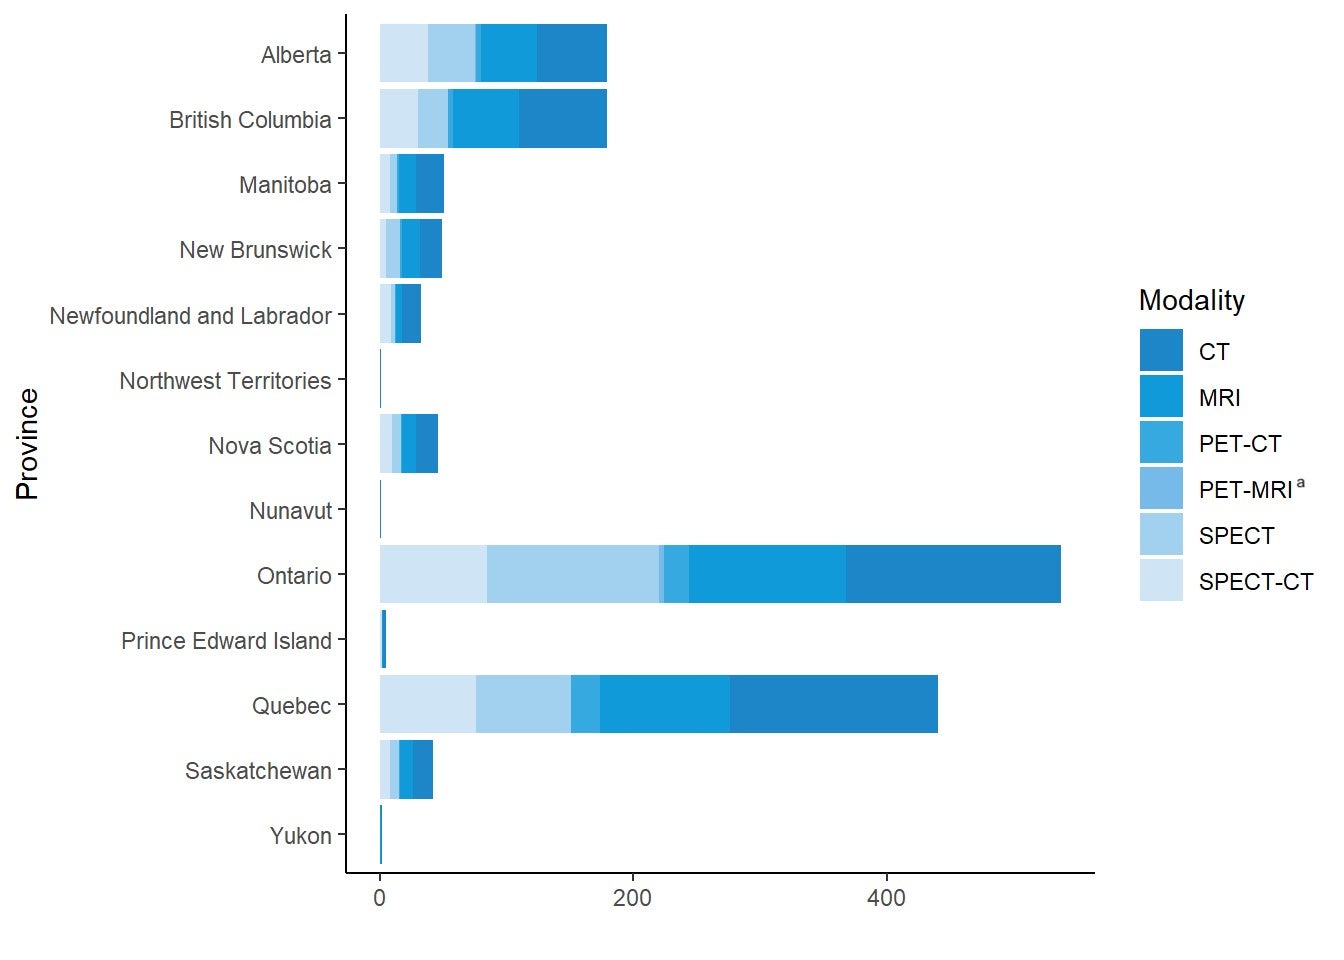
CT = computed tomography; MRI = magnetic resonance imaging; PET = positron emission tomography; PET-CT = positron emission tomography–computed tomography; PET-MRI = positron emission tomography–magnetic resonance imaging; SPECT = single-photon emission computed tomography; SPECT-CT = single-photon emission computed tomography–computed tomography.
a PET-MRI is used only for research purposes.
Number of Units by Provincial or Territorial Population
Table 4 shows the number of units reported per million people for all provinces and territories and for Canada as a whole. The five PET-MRI units located in Alberta and Ontario are used for research purposes only.
Table 4: CT, MRI, PET-CT, PET-MRI, SPECT, and SPECT-CT Units per Million Provincial or Territorial Population in 2019–2020
| Province or territory | Population | CT | MRI | PET-CT | PET-MRIa | SPECT | SPECT-CT |
|---|---|---|---|---|---|---|---|
| Number of unitsb per million populationc | |||||||
| Alberta | 4,395,586 | 12.5 | 10 | 0.9 | 0.2 | 8.4 | 8.6 |
| British Columbia | 5,105,576 | 13.5 | 10.2 | 0.8 | 0 | 4.7 | 5.9 |
| Manitoba | 1,373,859 | 16 | 10.2 | 0.7 | 0 | 4.4 | 5.8 |
| New Brunswick | 780,021 | 21.8 | 17.9 | 2.6 | 0 | 14.1 | 6.4 |
| Newfoundland and Labrador | 521,922 | 28.7 | 9.6 | 1.9 | 0 | 5.7 | 17.2 |
| Northwest Territories | 44,895 | 22.3 | 0 | 0 | 0 | 0 | 0 |
| Nova Scotia | 976,768 | 17.4 | 11.3 | 1 | 0 | 7.2 | 10.2 |
| Nunavut | 38,873 | 25.7 | 0 | 0 | 0 | 0 | 0 |
| Ontario | 14,659,616 | 11.5 | 8.5 | 1.4 | 0.2 | 9.2 | 5.8 |
| Prince Edward Island | 157,901 | 12.7 | 6.3 | 0 | 0 | 0 | 12.7 |
| Quebec | 8,522,800 | 19.2 | 12 | 2.7 | 0 | 8.8 | 8.9 |
| Saskatchewan | 1,178,657 | 13.6 | 8.5 | 0.8 | 0 | 5.9 | 6.8 |
| Yukon | 41,022 | 24.4 | 24.4 | 0 | 0 | 0 | 0 |
| Canada | 37,797,496 | 14.5 | 10 | 1.5 | 0.1 | 8.1 | 7.2 |
CT = computed tomography; MRI = magnetic resonance imaging; PET = positron emission tomography; PET-CT = positron emission tomography–computed tomography; PET-MRI = positron emission tomography–magnetic resonance imaging; SPECT = single-photon emission computed tomography; SPECT-CT = single-photon emission computed tomography–computed tomography.
a PET-MRI is used for research purposes only.
b Per-province unit counts according to the validator.
c The population (estimated) as of fourth quarter, 2019.23
Overall Number of Examinations
Table 5 shows the total number of examinations reported for all modalities across Canada for the most recent fiscal (or calendar) year. Data from validators are reported and are supplemented with data from private facilities where available. In Ontario, the 2020 validator data were not available for SPECT and SPECT-CT, and the 2017 CMII data were labelled in the table. Several jurisdictions combined SPECT and SPECT-CT exam data; therefore, an aggregated total is reported for these two modalities. A total of 1,200 exams were reported by a single site with PET-MRI. However, all PET-MRI exams are conducted for research purposes only.
Table 5: Total Examinations for the Latest Fiscal (or Calendar) Year for All Modalities Across Canada for Public and Private Facilities in 2019–2020
| Province or territory | CT | MRI | PET-CT | PET-MRIa | SPECT and SPECT-CT |
|---|---|---|---|---|---|
| Numbers of exams | |||||
| Albertab | 449,433 | 215,593 | 12,175 | 0 | 47,858 |
| British Columbia | 805,584 | 255,038 | 11,286 | 0 | 66,604 |
| Manitoba | 240,269 | 95,250 | 2,180 | 0 | 29,400 |
| New Brunswickb | 162,322 | 46,309 | 2,149 | 0 | 16,219 |
| Newfoundland and Labradorb | 98,967 | 21,929 | 1,704 | 0 | 33,095 |
| Nortdwest Territories | 5,789 | 0 | 0 | 0 | 0 |
| Nova Scotia | 170,603 | 50,664 | 2,818 | 0 | 30,235 |
| Nunavut | 3,081 | 0 | 0 | 0 | 0 |
| Ontario | 1,842,982 | 1,107,814 | 23,564 | 1,200 | 200,833 c |
| Prince Edward Islandb | 19,349 | 5,348 | 0 | 0 | 2,129 |
| Quebecb | 1,491,087 | 448,130 | 67,849 | 0 | 783,667 |
| Saskatchewanb | 124,918 | 81,652 | 2,050 | 0 | 33,723 |
| Yukon | 5,437 | 2,496 | 0 | 0 | 0 |
| Canada | 5,419,821 | 2,330,223 | 125,775 | 1,200 | 1,243,763 |
CT = computed tomography; MRI = magnetic resonance imaging; PET = positron emission tomography; PET-CT = positron emission tomography–computed tomography; PET-MRI = positron emission tomography–magnetic resonance imaging; SPECT = single-photon emission computed tomography; SPECT-CT = single-photon emission computed tomography–computed tomography.
a PET-MRI exams are conducted for research purposes only.
b Fiscal year 2018–2019.
c These are 2017 data.
Table 6 shows the per capita number of examinations reported for all modalities.
Table 6: Exams per thousand Population by Modality and Province/Territory
| Province or territory | Populationa | CT | MRI | PET-CT | PET-MRIb | SPECT and SPECT-CT |
|---|---|---|---|---|---|---|
| Exams per thousand population | ||||||
| Albertac | 4,395,586 | 102.2 | 49.0 | 2.8 | 0.0 | 10.9 |
| British Columbia | 5,105,576 | 157.8 | 50.0 | 2.2 | 0.0 | 13 |
| Manitoba | 1,373,859 | 174.9 | 69.3 | 1.6 | 0.0 | 21.4 |
| New Brunswickc | 780,021 | 208.1 | 59.4 | 2.8 | 0.0 | 20.8 |
| Newfoundland and Labradorc | 521,922 | 189.6 | 42.0 | 3.3 | 0.0 | 63.4 |
| Northwest Territories | 44,895 | 128.9 | 0.0 | 0.0 | 0.0 | 0 |
| Nova Scotia | 976,768 | 174.7 | 51.9 | 2.9 | 0.0 | 31 |
| Nunavut | 38,873 | 79.3 | 0.0 | 0.0 | 0.0 | 0 |
| Ontario | 14,659,616 | 125.7 | 75.6 | 1.6 | 0.1 | 13.7 |
| Prince Edward Islandc | 157,901 | 122.5 | 33.9 | 0.0 | 0.0 | 13.5 |
| Quebecc | 8,522,800 | 175.0 | 52.6 | 8.0 | 0.0 | 91.9 |
| Saskatchewanc | 1,178,657 | 106.0 | 69.3 | 1.7 | 0.0 | 28.6 |
| Yukon | 41,022 | 132.5 | 60.8 | 0.0 | 0.0 | 0 |
| Canada | 37,797,496 | 143.4 | 61.6 | 3.3 | 0.0 | 32.9 |
CT = computed tomography; MRI = magnetic resonance imaging; PET = positron emission tomography; PET-CT = positron emission tomography–computed tomography; PET-MRI = positron emission tomography–magnetic resonance imaging; SPECT = single-photon emission computed tomography; SPECT-CT = single-photon emission computed tomography–computed tomography.
a The population (estimated) as of fourth quarter, 2019.23
b PET-MRI exams are conducted for research purposes only.
c Fiscal year 2018–2019.
Sources of Funding
Survey participants were asked to report the source of funding for each site. Among the 401 sites that reported the sources of funding, 309 (77.1%) sites reported that they were publicly funded, 77 (19.2%) sites were privately funded, and 15 (3.7%) sites receiving funds from both public and private sources. A summary of provincial and territorial facility funding is provided in Table 7.
Private facilities were asked to report on the estimated percentage of operating revenue sourced from out-of-pocket payments or private insurance. Nine out of 92 sites that received private funding provided data and reported receiving on average 53.4% (range 2% to 100%) of their overall revenue from these funding sources.
Table 7: Summary of Source of Funding for Sites Included in the Canadian Medical Imaging Inventory 2019–2020 Update
| Province or territory | Publicly | Privately | Both | Not reported |
|---|---|---|---|---|
| Number of sites (%) | ||||
| Alberta | 43 (62.3) | 22 (31.9) | 4 (5.8) | 0 (0) |
| British Columbia | 53 (73.6) | 15 (20.8) | 2 (2.8) | 2 (2.8) |
| Manitoba | 17 (100) | 0 (0) | 0 (0) | 0 (0) |
| New Brunswick | 9 (75) | 1 (8.3) | 0 (0) | 2 (16.7) |
| Newfoundland and Labrador | 14 (100) | 0 (0) | 0 (0) | 0 (0) |
| Northwest Territories | 14 (93.3) | 1 (6.7) | 0 (0) | 0 (0) |
| Nova Scotia | 1 (100) | 0 (0) | 0 (0) | 0 (0) |
| Nunavut | 0 (0) | 0 (0) | 0 (0) | 1 (100) |
| Ontario | 90 (72) | 9 (7.2) | 3 (2.4) | 23 (18.4) |
| Prince Edward Island | 2 (100) | 0 (0) | 0 (0) | 0 (0) |
| Quebec | 53 (42.4) | 28 (22.4) | 4 (3.2) | 40 (32) |
| Saskatchewan | 12 (75) | 1 (6.2) | 2 (12.5) | 1 (6.2) |
| Yukon | 1 (100) | 0 (0) | 0 (0) | 0 (0) |
| Canada | 309 (65.7) | 77 (16.4) | 15 (3.2) | 69 (14.7) |
Overall Summary of Use: Hours per Day and Hours per Week
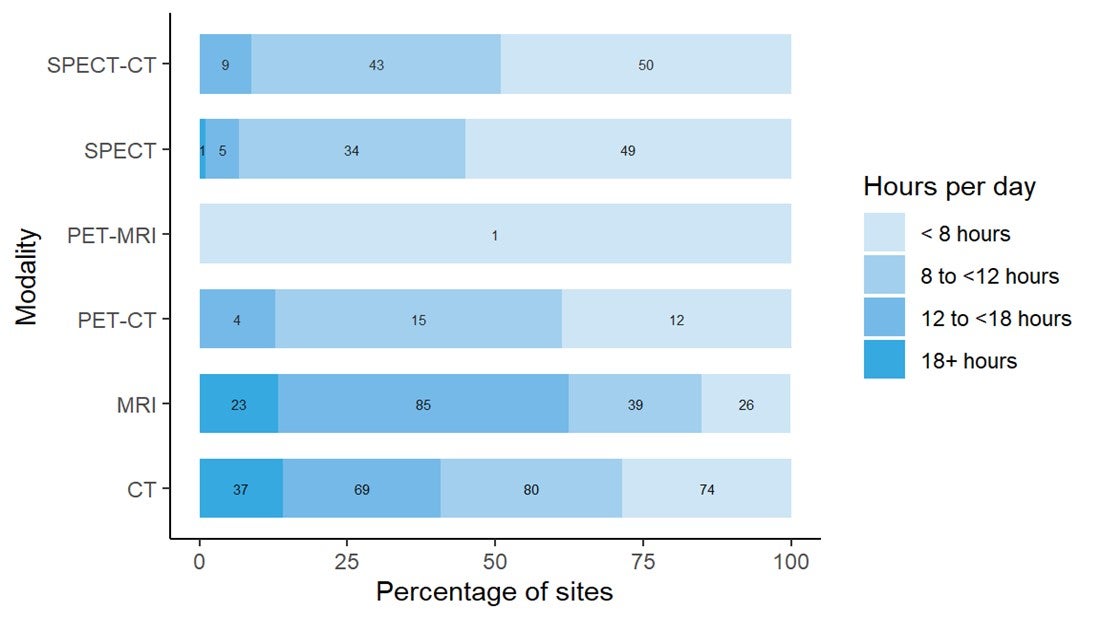
Figure 3 show the pattern of use by hours per day and hours per week, as well as by number and percentage of units, per modality for all available units in the public setting. The graph depicts the percentage of sites with units used less than eight hours a day, eight to less than 12 hours per day, 12 to less than 18 hours per day, and greater than 18 hours per day, and the bars are labelled with the number of sites in each category. The most heavily used modality is CT, followed by MRI.
Figure 2: Daily Use of Diagnostic Imaging Equipment in Hours by Percentages of Sites
CT = computed tomography; MRI = magnetic resonance imaging; PET = positron emission tomography; PET-CT = positron emission tomography–computed tomography; PET-MRI = positron emission tomography–magnetic resonance imaging; SPECT = single-photon emission computed tomography; SPECT-CT = single-photon emission computed tomography–computed tomography.
Note: Data derived from the survey question: “In an average 24-hour workday, how many hours are the [modality] units staffed through regular scheduled service capacity (do not include hours where staff are only on call)?” Where 2019–2020 data were not available, 2017 data were used, where available. Sites without data from 2017 or 2019–2020 were not included in the figures. Bars are labelled with the number of sites in each category.
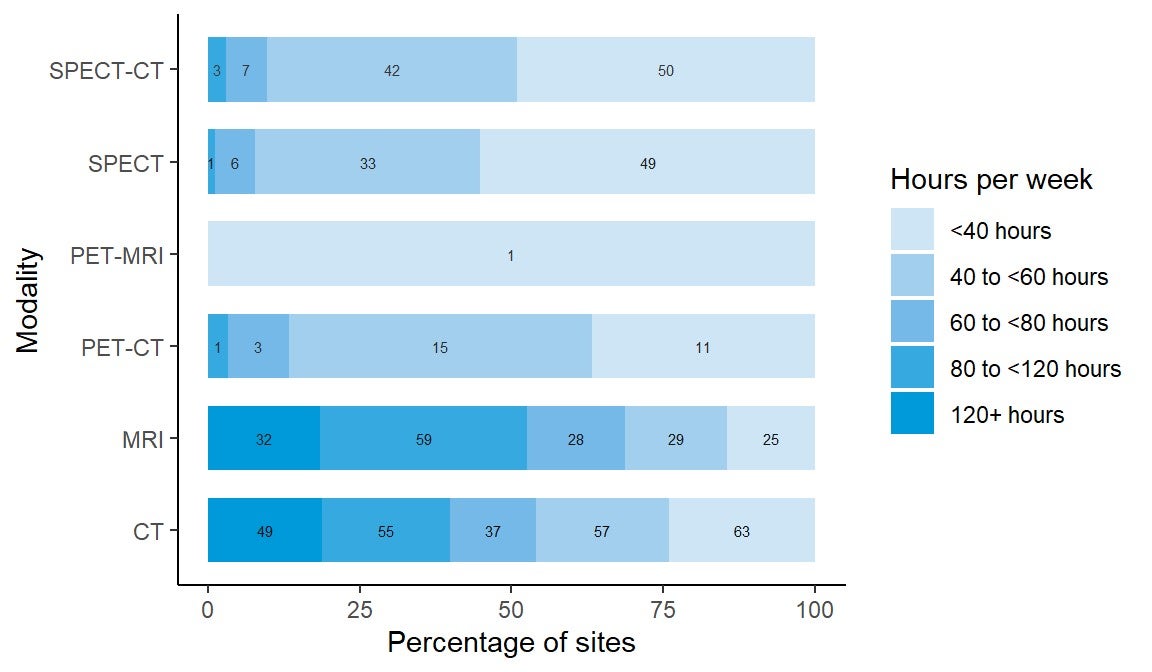
Figure 3: Weekly Use of Diagnostic Imaging Equipment in Hours by Percentages of Sites
CT = computed tomography; MRI = magnetic resonance imaging; PET = positron emission tomography; PET-CT = positron emission tomography–computed tomography; PET-MRI = positron emission tomography–magnetic resonance imaging; SPECT = single-photon emission computed tomography; SPECT-CT = single-photon emission computed tomography–computed tomography.
Note: Data derived from the survey question: “In an average 168-hour week, how many hours are the [modality] units staffed through regular scheduled service capacity (do not include hours where staff are only on call)?” Where 2019–2020 data were not available, 2017 data were used, where available. Otherwise, no imputation was done, and the site was not included in the totals. Bars are labelled with the number of sites in each category.
Overall Age of Units and Relationship of Age to Use
The age of imaging equipment was assessed, with the average age of units presented in Table 8 and the summary of age categories presented in Table 9. The age of each unit was estimated by calculating the number of years since the first year of operation (i.e., 2020 minus the first year of operation). Information on a total of 1,522 units at 455 sites across Canada had data on the first years of operation. The majority of imaging equipment has 10 or fewer years of operation: 65.9% of CT units, 60.9% of MRI units, 59.2% of PET-CT units, 28.0% of SPECT units, and 73.6% SPECT-CT units. The age of previously used imaging equipment (according to the survey) could not be estimated.
Table 8: Average Age of Imaging Units by Modality
| Modalities | Number of sites | Number of units | Average age (years) | Minimal age (years) | Maximal age (years) |
|---|---|---|---|---|---|
| CT | 357 | 530 | 8.1 | 0 | 23 |
| MRI | 263 | 374 | 8.6 | 0 | 20 |
| PET-CT | 41 | 49 | 8.2 | 0 | 17 |
| PET-MRI | 5 | 5 | 4.8 | 2 | 8 |
| SPECT | 172 | 300 | 13.2 | 1 | 33 |
| SPECT-CT | 154 | 269 | 6.6 | 0 | 17 |
CT = computed tomography; MRI = magnetic resonance imaging; PET = positron emission tomography; PET-CT = positron emission tomography–computed tomography; PET-MRI = positron emission tomography–magnetic resonance imaging; SPECT = single-photon emission computed tomography; SPECT-CT = single-photon emission computed tomography–computed tomography.
Note: Data derived from the survey question: “What year did (or will) the [modality] unit become operational?” subtracted from 2020. Those to be installed were not included in this table.
Table 9: Age of the Imaging Units in Years
| Modality | Yearsa | |||||
|---|---|---|---|---|---|---|
| 5 or less | 6 to 10 | 11 to 15 | 16 to 20 | 21 to 25 | More than 25 | |
| Number of units (%) | ||||||
| CT | 189 (35.7) | 160 (30.2) | 152 (28.7) | 27 (5.1) | 2 (0.4) | 0 (0) |
| MRI | 122 (32.6) | 106 (28.3) | 106 (28.3) | 40 (10.7) | 0 (0) | 0 (0) |
| PET-CT | 13 (26.5) | 16 (32.7) | 19 (38.8) | 1 (2.0) | 0 (0) | 0 (0) |
| PET-MRI | 4 (75) | 1 (25) | 0 (0) | 0 (0) | 0 (0) | 0 (0) |
| SPECT | 31 (10.3) | 53 (17.7) | 106 (35.3) | 87 (29.0) | 20 (6.7) | 3 (1) |
| SPECT-CT | 126 (46.8) | 72 (26.8) | 68 (25.3) | 3 (1.1) | 0 (0) | 0 (0) |
CT = computed tomography; MRI = magnetic resonance imaging; PET = positron emission tomography; PET-CT = positron emission tomography–computed tomography; PET-MRI = positron emission tomography–magnetic resonance imaging; SPECT = single-photon emission computed tomography; SPECT-CT = single-photon emission computed tomography–computed tomography.
a Age for each unit calculated from the survey question: “What year did (or will) the [modality] unit become operational?” subtracted from 2020.
New or Used Units
Of 1,205 imaging units with information, 1,160 were newly purchased and 45 were previously used units. PET-CT is the most commonly reused imaging modality, with 7.3% of all units fitting into this category, and PET-MRI is the imaging modality least likely to be reused, with none of the units reused.
Computed Tomography
Number and Location of CT Units
Three hundred and sixty-nine sites in all provinces or territories have one or more CT units (mean 1.5 per site). There were up to nine units per site, for a total of 549 units (22 at free-standing sites). Ontario, Quebec, and British Columbia had the most CT units. The number of units in all provinces or territories ranged from 11.5 to 28.7 per million population, but this did not reflect accessibility, particularly in provinces and territories with large remote areas.
One hundred and eighty-nine CT units were installed between 2015 and 2019–2020. Among the units with information, 50 were replacements for decommissioned units, 13 were new units, and 54 were not specified as new or replacement. Forty-six sites had decommissioned one or more CT units (most decommissioned one unit) since the last survey in 2017, and 57 sites reported planned installations of one or more CT units in the next two years (Table 10).
Table 10: Summary of Availability and Status of CT Units by Province and Territory in 2019–2020
| Province or territory | Sites with availabilitya | Total unitsb (free-standing facilities) | Sites planning to install new or replacement units c | Sites decommissioning since 2017d | Units per million populatione |
|---|---|---|---|---|---|
| Alberta
|
43
|
55 (3)
|
4
|
6
|
12.5
|
| British Columbia
|
46
|
69 (2)
|
9
|
7 | 13.5 |
|
Manitoba |
16 | 22 (0) | 4 | 3 | 16.0 |
|
New Brunswick |
11 | 17 (0) | 4 | 2 | 21.8 |
|
Newfoundland and Labrador |
14 | 15 (0) | 1 | 3 | 28.7 |
|
Northwest Territories |
1 | 1 (0) | 0 | 1 | 22.3 |
|
Nova Scotia |
14 | 17 (0) | 5 | 1 | 17.4 |
|
Nunavut |
1 | 1 (0) | 0 | 0 | 25.7 |
|
Ontario |
107 | 169 (4) | 25 | 17 | 11.5 |
|
Prince Edward Island |
2 | 2 (0) | 0 | 1 | 12.7 |
|
Quebec |
100 | 164 (12) | 2 | 4 | 19.2 |
|
Saskatchewan |
13 | 16 (1) | 3 | 1 | 13.6 |
|
Yukon |
1 | 1 (0) | 0 | 0 | 24.4 |
|
Canada |
369 | 549 (22) | 57 | 46 | 14.5
|
CT = computed tomography.
a Data derived from number of units with technical details (make, model, first year of operation, and status as decommissioned/non-decommissioned), as provided by survey respondents to CMII and CIHI and industry sources.
b Data obtained from provincial validators.
c Data derived from the survey question: “Do you have plans to install the following in the next two years?”
d Data derived from the survey question: “Have you decommissioned a [modality] unit since January 2, 2017?”
e The population (estimated) as of fourth quarter, 2019.23
Free-Standing Institutes
Overall, there are 22 CT units at 22 free-standing institutes across Canada. Free-standing institutes were mainly identified as privately funded and are located in five provinces: Alberta, British Columbia, Ontario, Quebec, and Saskatchewan. Most sites did not provide information on examinations per year, with only three free-standing sites reporting these data.
Geographical Distribution of CT Units in 2019–2020
Figure 4 shows the geographical distribution of CT units across Canada mapped to the level of settlement (city or town), with circle diameter proportional to the number of units. Counts for all sites within a city/town were aggregated.
Figure 4: Geographic Distribution of CT Units in Canadian Cities or Towns
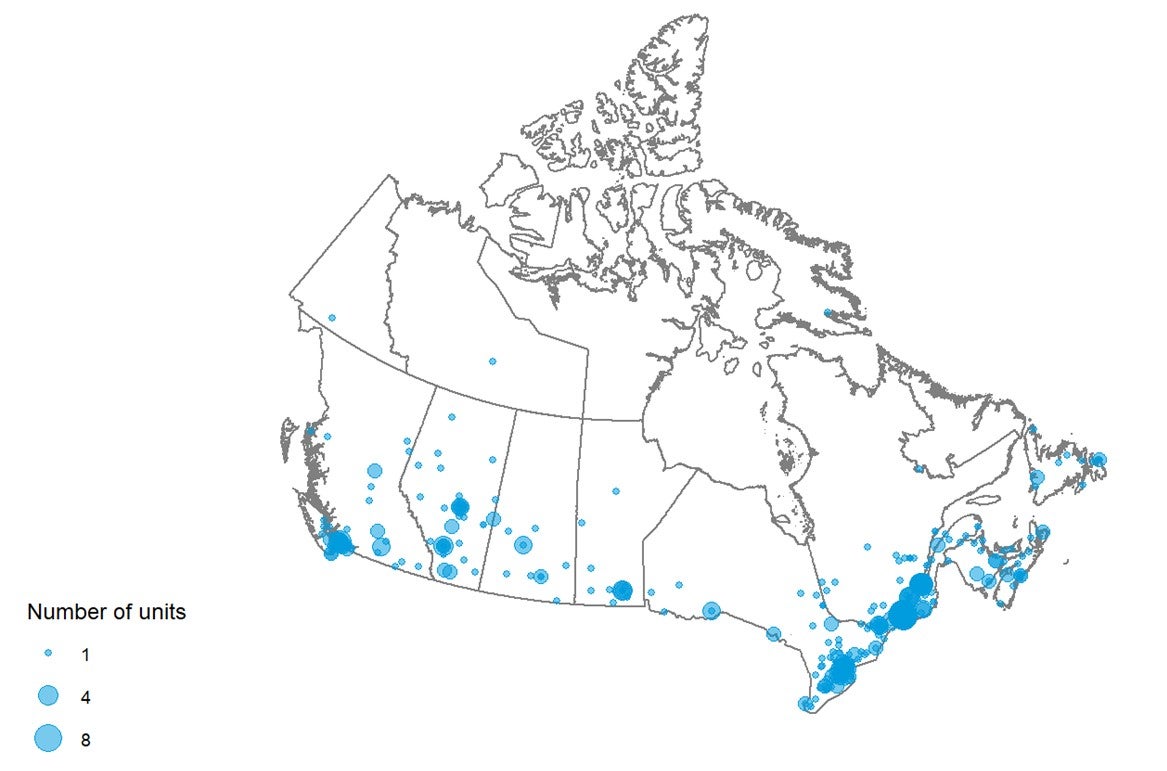
CT = computed tomography.
Note: Availability and unit counts by site were derived from validator data; where these were unavailable, the data were from the survey. Mobile units appear as one unit at each of the sites served.
Mobile CT
Two sites indicated that they were served by two mobile units in Quebec. As well, there is a mobile stroke unit in Alberta that includes a portable CT unit.
Number of Examinations in a Fiscal Year
Across Canada, a total of 5,419,821 examinations per year were reported for 549 units. Data quoted were primarily supplied by provincial and territorial validators for either the latest fiscal year or calendar year and were supplemented with data from free-standing sites. The average number of exams per unit was 9,872.2. Table 11 shows the total number of exams by provinces and territories and the number of exams per thousand people.
Table 11: Total Examinations per Fiscal Year Using CT Units in 2019–2020
| Province or territory | Units with dataa (free-standing sites) | All unitsb | Total examsb | Exams per unit | Populationc | Exams per thousand population |
|---|---|---|---|---|---|---|
| Albertad | 55 (3) | 55 | 449,433e | 8,171.5 | 4,395,586 | 102.2 |
| British Columbia | 69 (2) | 69 | 805,584 | 11,675.1 | 5,105,576 | 157.8 |
| Manitoba | 22 (0) | 22 | 240,269 | 10,921.3 | 1,373,859 | 174.9 |
| New Brunswick | 17 (0) | 17 | 162,322d | 9,548.4 | 780,021 | 208.1 |
| Newfoundland and Labrador | 15 (0) | 15 | 98,967d | 6,597.8 | 521,922 | 189.6 |
| Northwest Territories | 1 (0) | 1 | 5,789 | 5,789.0 | 44,895 | 128.9 |
| Nova Scotia | 17 (0) | 17 | 170,603 | 10,035.5 | 976,768 | 174.7 |
| Nunavut | 1 (0) | 1 | 3,081 | 3,081.0 | 38,873 | 79.3 |
| Ontario | 169 (4) | 169 | 1,842,982 | 10,905.2 | 14,659,616 | 125.7 |
| Prince Edward Island | 2 (0) | 2 | 19,349d | 9,674.5 | 157,901 | 122.5 |
| Quebec | 164 (12) | 164 | 1,491,087d | 9,092.0 | 8,522,800 | 175.0 |
| Saskatchewan | 16 (1) | 16 | 124,918d | 7,807.4 | 1,178,657 | 106.0 |
| Yukon | 1 (0) | 1 | 5,437 | 5,437.0 | 41,022 | 132.5 |
| Canada | 549 (22) | 549 | 5,419,821 | 9,872.2 | 37,797,496 | 143.4 |
CT = computed tomography.
a Data derived from number of units with technical details (make, model, first year of operation, and status as decommissioned/non-decommissioned).
b Data derived from the question: “For all [modality] units, how many examinations on average were conducted in the last fiscal year?”
c The population (estimated) as of fourth quarter, 2019.23
d For Alberta, data from free-standing sites were excluded from the Alberta contribution, but are as follows: total exams: 2,364; total exams per unit: 788; exams per thousand population: 0.54. For the purposes of overall Canadian analysis and future projections, data from public and free-standing sites in Alberta have been combined and have been included in the Canadian total.
e Fiscal year 2018–2019.
Age of CT Units by CMII Survey Years
There are 317 out of 549 (57.7%) imaging units with information on the first years of operation. Table 12 shows the first years of operation by the CMII survey year (2015, 2017, and 2020) and jurisdiction. There were 60 CT units installed after the last CMII survey in 2017.
Table 12: First Years of Operation of the CT Units by Province and Territory
| Province or territory | 2015 years and earlier | 2016 to 2017 years | 2018 to 2020 years | 2021 years and later | Total |
|---|---|---|---|---|---|
| n (%) of currently operating units by first year of operation | |||||
| Alberta | 35 (79.5) | 6 (13.6) | 3 (6.8) | 0 (0) | 44 (100) |
| British Columbia | 25 (51) | 11 (22.4) | 13 (26.5) | 0 (0) | 49 (100) |
| Manitoba | 12 (60) | 7 (35) | 1 (5) | 0 (0) | 20 (100) |
| New Brunswick | 4 (66.7) | 2 (33.3) | 0 (0) | 0 (0) | 6 (100) |
| Newfoundland and Labrador | 6 (85.7) | 0 (0) | 1 (14.3) | 0 (0) | 7 (100) |
| Northwest Territories | 0 (0) | 1 (100) | 0 (0) | 0 (0) | 1 (100) |
| Nova Scotia | 15 (93.8) | 0 (0) | 1 (6.2) | 0 (0) | 16 (100) |
| Nunavut | NR | NR | NR | NR | NR |
| Ontario | 40 (74.1) | 13 (24.1) | 1 (1.9) | 0 (0) | 54 (100) |
| Prince Edward Island | 0 (0) | 1 (100) | 0 (0) | 0 (0) | 1 (100)
|
| Quebec | 65 (58.6) | 6 (5.4) | 40 (36) | 0 (0) | 111 (100) |
| Saskatchewan | 8 (100) | 0 (0) | 0 (0) | 0 (0) | 8 (100) |
| Yukon | NR | NR | NR | NR | NR |
| Canada | 210 (66.2) | 47 (14.8) | 60 (18.9) | 0 (0) | 317 (100) |
CT = computed tomography; NR = not reported.
Note: Data derived from the survey question: “What year did (or will) the [modality] unit become operational?”
Full-Time Equivalent Medical Radiation Technologists
Survey participants were asked to provide information on the number of full-time equivalent (FTE) MRTs assigned to all CT units at the site level. An FTE position for an MRT is considered to amount to an eight-hour day, five days per week.
One hundred and ninety-one sites (56.5% of 338 sites with CT units) reported information. There were one to 25 FTE MRTs assigned per site. For sites that have a single CT unit and a large number of MRTs assigned to that unit, survey respondents may have reported a total count at the facility level rather than the site level, the site may be located in densely populated area, and/or the CT unit may be in operation 24 hours a day. The numbers of FTE MRTs per site by provinces and territories are shown in Table 13.
Table 13: Numbers of Full-time Equivalent Medical Radiation Technologists per Site for CT Units by Province and Territory
| Province or territory | All sites with information | Total FTE MRTs | FTE MRTs per million population | Average per site | Minimal number per site | Maximal number per site |
|---|---|---|---|---|---|---|
| Alberta | 36 | 165 | 37.5 | 4.6 | 1 | 18 |
| British Columbia | 37 | 194 | 38 | 5.2 | 1 | 23 |
| Manitoba | 15 | 91 | 66.2 | 6.1 | 1 | 19 |
| New Brunswick | 7 | 31 | 39.7 | 4.4 | 2 | 7 |
| Newfoundland and Labrador | 13 | 37 | 70.9 | 2.9 | 1 | 6 |
| Northwest Territories | 1 | 2 | 44.5 | 2 | 2 | 2 |
| Nova Scotia | 10 | 50 | 51.2 | 5 | 2 | 15 |
| Nunavut | NR | NR | NR | NR | NR | NR |
| Ontario | 32 | 217 | 14.8 | 6.8 | 1 | 21 |
| Prince Edward Island | 1 | 3 | 19 | 3 | 3 | 3 |
| Quebec | 27 | 166 | 19.5 | 6.2 | 1 | 25 |
| Saskatchewan | 11 | 50 | 42.4 | 4.6 | 1 | 11 |
| Yukon | 1 | 3 | 73.1 | 3 | 3 | 3 |
| Canada | 191 | 1,009 | 26.7 | 5.3 | 1 | 25 |
CT = computed tomography; FTE = full-time equivalent; MRT = medical radiation technologist; NR = not reported.
Note: Data derived from the survey question: “How many FTE technologists are assigned to all [modality] units (collective number of FTEs for all units)?”
Typical Hours of Operation in a Week, and All-Day and Weekend Use
Hours Per Day and 24-Hour Use for CT Units
Two hundred and sixty out of 455 publicly funded sites provided data for the average number of hours per day that CT units were in use. Across all provinces or territories, CT units were used for an average of 8.5 hours to 14.1 hours per day (Table 87). Seventy-four (28.5%) units were used for less than eight hours per day, 80 (30.8%) units were used for eight to less than 12 hours per day, 69 (26.5%) units were used for 12 to less than 18 hours a day, and 37 (14.2%) units were used for more than 18 hours per day. Eighty-nine (34.2%) sites reported that at least one unit at their site was used for 24 hours a day (Table 88).
Hours Per Week and Weekend Use for CT Units
Two hundred and sixty-one out of 455 publicly funded sites provided data for the average number of hours per week that CT units were in use. Across all provinces or territories, CT units were used for an average of 45 hours to 93.5 hours per week. Sixty-three (24.1%) units were used for less than 20 hours per week, 57 (21.8%) units were used for 40 to less than 60 hours per week, 37 (14.2%) units were used for 60 to less than 80 hours per week, 55 (21.1%) units were used for 80 to less than 120 hours a week, and 49 (18.8%) units were used for more than 120 hours per week (Table 89). One hundred and ninety-nine (76.2%) sites reported that at least one unit at their site was used at weekends (Table 90).
Planned and Unplanned Downtime for CT Units
Among the 317 sites with CT units, 184 sites reported the planned and unplanned downtime in a year. The mean planned downtime was 35.4 hours, ranging from three to 288 hours per year. The mean unplanned downtime was 50.1 hours, ranging from 0 to 359 hours per year. At 82 sites, the planned downtime was less than unplanned downtime for 82 imaging units. Some common reasons for discrepancies between planned and unplanned downtime include catastrophic failure, equipment breakdown (especially older equipment, which may break down more frequently), difficulty sourcing parts, waiting for parts, tube replacement, software upgrades, and power outages. The distributions of planned and unplanned downtime for CT units by jurisdiction are shown in Table 14 (Table 91 and Table 92).
Table 14: Annual Planned and Unplanned Downtime at Sites with CT Units by Province and Territory
| Province or territory | Annual downtime – planned (hours) | Annual downtime – unplanned (hours) |
|---|---|---|
| Mean downtime, hours per year (n, range) | ||
| Alberta | 28.1 (39, 12 to 108) |
45.9 (39, 5 to 359) |
| British Columbia | 45.5 (31, 9 to 288) |
57.3 (18, 10 to 240) |
| Manitoba | 33.7 (15, 12 to 96) |
82.7 (13, 16.5 to 300) |
| New Brunswick | 34.3 (7, 16 to 72) |
53.4 (7, 24 to 120) |
| Newfoundland and Labrador | 29.6 (13, 12 to 84) |
21.8 (11, 10 to 48) |
| Northwest Territories | 35 (1, 35 to 35) |
15 (1, 15 to 15) |
| Nova Scotia | 27 (9, 15 to 48) |
54.1 (8, 20 to 144) |
| Nunavut | NR | NR |
| Ontario | 38.8 (30, 8 to 220) |
50.3 (23, 0 to 300) |
| Prince Edward Island | 48 (1, 48 to 48) |
12 (1, 12 to 12) |
| Quebec | 40 (25, 3 to 168) |
41.4 (21, 0 to 168) |
| Saskatchewan | 30.9 (11, 16 to 96) |
71 (7, 8 to 200) |
| Yukon | 10 (1, 10 to 10) |
20 (1, 20 to 20) |
| Canada | 35.4 (183, 3 to 288) |
50.1 (150, 0 to 359) |
NR = not reported.
Note: Data derived from the survey question: “How much planned downtime is anticipated for scheduled maintenance for all units in a given year? (expressed in hours)” and “How much unplanned downtime is experienced for all units in a given year? (expressed in hours).”
Types of CT Use
Survey participants were asked to provide the overall percentage of use for cardiac exams, noncardiac exams, research, and any other type of use. Usage breakdown was available for 178 sites. On average, the highest mean percentage of use for CT was noncardiac, at 95.5% (range 0% to 100%), followed by cardiac use, at 1.4% (range 0% to 15%), and research use, at 0.6% (range 0% to 30%). The percentages of cardiac, noncardiac, and research use are available in Table 93.
Survey participants reported the overall percentage of use for CT for diagnostic, interventional, and research purposes, as well as other type of use. Usage breakdown was available for 188 sites with CT units. On average, the highest mean percentage of use for CT was for diagnostic use, at 93.8% (range 0% to 100%), followed by interventional use, at 4% (range 0% to 60%), and research use, at 0.5% (range 0% to 21%).
Data on the overall percentage of use by discipline for all CT units were collected from survey participants. The categories included oncology, respiratory, hepatobiliary, musculoskeletal, inflammatory or infectious disease, neurological, cardiac, trauma, and other. Usage breakdown was available for 122 sites with CT units. On average, the highest mean percentage of use for CT was oncology exams, at 24.9% (use at individual sites ranged from 0% to 100%), followed by neurological exams, at 17.9% (range 0% to 55%), hepatobiliary exams, at 13.3% (range 0% to 40%), and respiratory exams, at 12.9% (range 0% to 40%). Details are available in Table 94. Due to the low response rate, data may not be representative of all sites.
Clinical Decision Support Tools for CT Units
Survey participants were asked to provide information on the adoption of CDSTs at the point of care by referring physicians ordering CT exams. A CDST was described as a tool that provides real-time guidance to physicians on the appropriateness of diagnostic imaging tests for a given patient during the ordering process. Among the 169 sites with information on the use of CDSTs, 103 (61.0%) reported that referring physicians used CDSTs for CT exams. The use of CDSTs by province or territory is summarized in Table 15.
Table 15: Use of Clinical Decision Support Tools at Sites with CT Units by Imaging Modality
| Province or territory | CDST used | CDST not used | Total |
|---|---|---|---|
| Number of sites (%) | |||
| Albertaa | 0 (0) | 39 (100) | 39 (100) |
| British Columbia | 25 (78.1) | 7 (21.9) | 32 (100) |
| Manitoba | 14 (93.3) | 1 (6.7) | 15 (100) |
| New Brunswick | 4 (80) | 1 (20) | 5 (100) |
| Newfoundland and Labrador | 8 (66.7) | 4 (33.3) | 12 (100) |
| Northwest Territories | 1 (100) | 0 (0) | 1 (100) |
| Nova Scotia | 8 (100) | 0 (0) | 8 (100) |
| Nunavut | NR | NR | NRtd |
| Ontario | 23 (82.1) | 5 (17.9) | 28 (100) |
| Prince Edward Island | NR | NR | No data |
| Quebec | 12 (66.7) | 6 (33.3) | 18 (100) |
| Saskatchewan | 7 (70) | 3 (30) | 10 (100) |
| Yukon | 1 (100) | 0 (0) | 1 (100) |
| Canada | 103 (61.0) | 66 (39.0) | 169 (100) |
CDST = clinical decision support tool; CT = computed tomography; NR= not reported.
a Data from 2018–2019.
Note: Data derived from the survey question: “Is a clinical decision support tool used at the point of care by medical professionals referring patients to medical imaging? A clinical decision support tool provides real-time guidance to physicians on the appropriateness of diagnostic imaging tests for a given patient during the ordering process.”
Use of Peer Review for CT Images
Survey participants were asked to provide information on the use of peer review as a quality assurance tool for reading and interpreting images. Of 176 sites that responded to the question as to whether CT images were peer-reviewed, 110 (62.5%) responded “yes.” Alberta had the highest use of peer review, with 100%, followed by Ontario and British Columbia. The use of peer review at site level is summarized by province or territory in Table 16.
Table 16: Use of Peer Review for CT Images, Summarized by Province/Territory
| Province or territory | Conduct peer review | Do not conduct peer review | Total |
|---|---|---|---|
| Number of sites (%) | |||
| Alberta | 39 (100) | 0 | 39 (100) |
| British Columbia | 24 (72.7) | 9 (27.3) | 33 (100) |
| Manitoba | 0 | 14 (100) | 14 (100) |
| New Brunswick | 2 (28.6) | 5 (71.4) | 7 (100) |
| Newfoundland and Labrador | 3 (28.6) | 10 (76.9) | 13 (100) |
| Northwest Territories | 0 | 1 (100) | 1 (100) |
| Nova Scotia | 3 (27.3) | 8 (72.7) | 11 (100) |
| Nunavut | NR | NR | NR |
| Ontario | 23 (79.3) | 6 (20.7) | 29 (100) |
| Prince Edward Island | 0 | 1 (100) | 1 (100) |
| Quebec | 14 (66.7) | 7 (33.3) | 21 (100) |
| Saskatchewan | 2 (28.6) | 5 (71.4) | 7 (100) |
| Yukon | NR | NR | NR |
| Canada | 110 (62.5) | 66 (37.5) | 176 (100) |
CT = computed tomography; NR = not reported.
Note: Data derived from the survey question: “Do radiologists at your facility participate in a peer review program for image reading and interpretation for the purpose of quality assurance?”
Integration of Artificial Intelligence for CT
Survey participants were asked to report on the use of AI in the clinical and/or research setting for the following purposes: lowering radiation dose, reading and interpreting images, reconstructing images, planning treatment, predicting outcomes, and carrying out administrative tasks. Most sites either did not respond to the questions on use of AI or answered with “no,” indicating that it was not used. Results for CT are shown in Table 17.
Table 17: Summary of Use of AI in CT
| Use of AI | Number of sites / number of responses | Number of sites – yes (%) | Clinical / research / both | Provinces (number of sites) |
|---|---|---|---|---|
| Is AI used in lowering radiation dose? | 306 / 194 | 26a (8.5) | 23 / 0 / 2 NR 1 |
AB (1) BC (12), NL (1), ON (3), QC (2), SK (5), NT (1) |
| Is AI used in reading and interpreting images? | 306 / 195 | 9 (2.9) | 7 / 1 / 0 NR 1 |
BC (2), ON (4), QC (2), SK (1) |
| Is AI used in image reconstruction? | 306 / 193 | 21b (6.9) | 19 / 0 / 2 | AB (1), BC (9), ON (1), QC (5), SK (4), NT (1) |
| Is AI used in treatment planning? | 306 / 196 | 4 (1.2) | 3 / 0 / 1 | AB (1), ON (1), MB (1), NT (1) |
| Is AI used in predicting outcomes? | 306 / 192 | 1 (0.3) | 1 / 0 / 0 | ON (1) |
| Is AI used for administrative tasks? | 306 / 194 | 1 (0.3) | NR 1 | BC (1) |
AB = Alberta; AI = artificial intelligence; BC = British Columbia; CT = computed tomography; MB = Manitoba; NL = Newfoundland and Labrador; NR = not reported;
NT = Northwest Territories; NU = Nunavut; ON = Ontario; QC = Quebec; SK = Saskatchewan.
a Five sites responded “no” but then provided setting and/or specific comments on use, and they are included in this count.
b Two sites responded “no” but then provided setting and/or specific comments on use, and they are included in this count.
Note: Data derived from the survey question: “Is artificial intelligence used to support: The reading/interpretation of images? Predicting outcomes? Lower radiation dose? Image resolution/reconstruction enhancement? Treatment planning? Administrative tasks?”
Twenty-six sites (8.5%) in seven jurisdictions reported using AI in lowering radiation dose in CT imaging. Twenty-three (7.5%) sites reported use in the clinical setting, two (0.7%) reported use in both clinical and research settings, and one did not report the setting in which AI was used.
Nine sites (2.9%) in four jurisdictions reported using AI for reading and interpreting CT images; of these, seven (2.3%) used AI in the clinical setting and one in the research setting, with one missing. Specific clinical uses identified for CT were mammography, colonography, computer-aided diagnosis such as lung lesion software, calcium scoring and vessel analysis, and RAPID software for stroke patients. Specific research uses identified were described as “internal development and validation of commercially available algorithms in application to chest X-ray and head CT.”
Twenty-one sites (6.9%) in six jurisdictions reported using AI in CT image reconstruction: 19 in the clinical setting and two in both clinical and research settings. Four sites (1.2%) reported using AI for treatment planning with CT in four jurisdictions: three in the clinical setting and one in both clinical and research. Uses were described as general treatment planning and planning radiotherapy treatments in cancer.
One site (0.3%) reported using AI for predicting outcomes based on CT images, in the clinical setting. The use was described as “Allowing physicians to rapidly assess the severity of patients’ strokes — and determine the most appropriate treatment based on available collateral circulation.”
One site (0.3%) reported using AI for CT administrative tasks, for an unreported setting. No further details were given.
Exam-Ordering Practices at Sites with CT Units
Survey participants were asked to report their use of various exam-ordering practices from the following options: requests by automated order entry, paper, fax, telephone, and centralized order entry for some, or all, exams. Among the 200 sites that provided a response to the question, the most common exam-ordering practice across Canada for CT is paper and fax, at 98% of sites, followed by automated order entry, at 51% of sites across Canada. The use of exam-ordering practices is summarized by province and territory in Table 18.
Table 18: Exam-Ordering Practice at Sites With CT Units by Province and Territory
| Automated entry forms | Paper forms | Requests – fax | Requests – telephone | Centralized booking – all exams | Centralized booking – some exams | |||||||
|---|---|---|---|---|---|---|---|---|---|---|---|---|
| Number (%) of sites that use these exam-ordering practices | ||||||||||||
| Yes | No | Yes | No | Yes | No | Yes | No | Yes | No | Yes | No | |
| Alberta | 37 (94.9) | 2 (5.1) | 38 (100) | 0 (0) | 39 (100) | 0 (0) | 15 (38.5) | 24 (61.5) | 2 (5.1) | 37 (94.9) | 14 (35.9) | 25 (64.1) |
| British Columbia | 20 (48.8) | 21 (51.2) | 40 (97.6) | 1 (2.4) | 39 (95.1) | 2 (4.9) | 10 (25.6) | 29 (74.4) | 12 (30.8) | 27 (69.2) | 15 (36.6) | 26 (63.4) |
| Manitoba | 2 (13.3) | 13 (86.7) | 14 (93.3) | 1 (6.7) | 14 (93.3) | 1 (6.7) | 8 (53.3) | 7 (46.7) | 2 (13.3) | 13 (86.7) | 1 (7.1) | 13 (92.9) |
| New Brunswick | 2 (33.3) | 4 (66.7) | 6 (100) | 0 (0) | 6 (100) | 0 (0) | 3 (50) | 3 (50) | 2 (33.3) | 4 (66.7) | 3 (50) | 3 (50) |
| Newfoundland and Labrador | 5 (38.5) | 8 (61.5) | 12 (100) | 0 (0) | 13 (100) | 0 (0) | 2 (15.4) | 11 (84.6) | 10 (76.9) | 3 (23.1) | 10 (83.3) | 2 (16.7) |
| Northwest Territories | 0 (0) | 1 (100) | 1 (100) | 0 (0) | 1 (100) | 0 (0) | 1 (100) | 0 (0) | 1 (100) | 0 (0) | 0 (0) | 1 (100) |
| Nova Scotia | 5 (45.5) | 6 (54.5) | 11 (100) | 0 (0) | 11 (100) | 0 (0) | 6 (54.5) | 5 (45.5) | 6 (60) | 4 (40) | 7 (63.6) | 4 (36.4) |
| Nunavut | NR | NR | NR | NR | NR | NR | NR | NR | NR | NR | NR | NR |
| Ontario | 19 (55.9) | 15 (44.1) | 32 (94.1) | 2 (5.9) | 32 (97) | 1 (3) | 11 (33.3) | 22 (66.7) | 17 (51.5) | 16 (48.5) | 15 (51.7) | 14 (48.3) |
| Prince Edward Island | 2 (100) | 0 (0) | 2 (100) | 0 (0) | 2 (100) | 0 (0) | 0 (0) | 2 (100) | 0 (0) | 2 (100) | 2 (100) | 0 (0) |
| Quebec | 7 (26.9) | 19 (73.1) | 26 (100) | 0 (0) | 26 (100) | 0 (0) | 3 (12.5) | 21 (87.5) | 10 (38.5) | 16 (61.5) | 4 (15.4) | 22 (84.6) |
| Saskatchewan | 3 (27.3) | 8 (72.7) | 11 (100) | 0 (0) | 10 (100) | 0 (0) | 6 (60) | 4 (40) | 7 (63.6) | 4 (36.4) | 4 (80) | 1 (20) |
| Yukon | 0 (0) | 1 (100) | 1 (100) | 0 (0) | 1 (100) | 0 (0) | 0 (0) | 1 (100) | 1 (100) | 0 (0) | 1 (100) | 0 (0) |
| Canada | 102 (51) | 98 (49) | 194 (98) | 4 (2) | 194 (98) | 4 (2) | 68 (34.7) | 128 (65.3) | 71 (36.2) | 125 (63.8) | 76 (40.6) | 111 (59.4) |
CT = computed tomography; NR = not reported.
Note: Data derived from the survey question: “Are automated order entry forms (exams request) used?”; “Are paper forms (exams requests) used?”; “Are requests received by fax?”; “Are requests received by phone?”; and “Is a centralized order entry (booking) system used? For all exams: yes/no; For some exams: yes/no.”
Exam-Ordering Privileges
Jurisdictional validators were asked to provide details on the exam-ordering privileges of various types of health care professionals working in the public setting. Responses are summarized in Table 19 (Table 95 and Table 96). The results show that clinical specialists in all provinces and territories are authorized to order CT exams, although some provinces restrict ordering privileges to specific types of specialists. Similarly, family physicians and general practitioners can order CT exams in all provinces and territories. In Saskatchewan, specifically in Saskatoon, all CT exam orders require a radiologist consultation, unless ordered by a specialist physician. Nurse practitioners in all jurisdictions apart from Ontario have CT ordering privileges, and, in Alberta, other allied health professionals may qualify to request CT exams depending on licensing and credentialing requirements. Medical students and residents, as well as physician assistants, can order CT exams under the supervision of someone who has authorization privileges in Manitoba and Prince Edward Island.
The British Columbia validator noted that, although health care professionals such as chiropractors, dentists, and podiatric surgeons can order CT exams, these exams may not always be covered under the public medical services plan. No data were available for Quebec. As well, for New Brunswick, the responses came from one of the two regional health authorities, the Horizon Health Network.
Table 19: Types of Health Care Professionals With CT Exam-Ordering Privileges
| Province or territory | Clinical specialists | Family physicians/ general practitioners | Nurse practitioners |
|---|---|---|---|
| Alberta | Yes | Yes | Yes |
| Depending on licensing and credentialing, other allied health professionals may have qualifications to request CT exams | |||
|
British Columbia |
Yes | Yes | Yes |
| Other: chiropractor, dentists, podiatric surgeon While a health care professional can order a CT exam, it may not always be covered under a public medical services plan |
|||
|
Manitoba |
Yes | Yes | Yes |
| Health care learners (e.g., medical students, residents, and physician assistants) can order these tests under the supervision of someone who has authorization | |||
| New Brunswicka | Yes | Yes | Yes |
| Newfoundland and Labrador | Yes | Yes | Yes |
| Northwest Territories | Yes | Yes | Yes |
| Nova Scotia | Yes | Yes | Yes |
| Nunavut | Yes | Yes | Yes |
|
Ontario |
Yes | Yes | No |
| Specialty physicians and surgeons | |||
|
Prince Edward Island |
Yes | Yes | Yes |
| Health care learners (e.g., medical students, residents, and physician assistants) can order these tests under the supervision of someone who is authorized to order them | |||
| Quebec | NR | NR | NR |
| Saskatchewan | Yes | Yes | Yes |
| In Saskatoon only, a radiologist consultation is required unless ordered by a specialist physician | |||
| Yukon | Yes | Yes | Yes |
CT = computed tomography; NR = no response.
a Horizon Health.
Note: Data derived from the survey question: “Which health care professionals can order imaging exams for CT?”
Imaging Equipment Servicing Methods at Sites with CT Units
Survey participants were asked to report on methods for servicing imaging equipment. The servicing methods included à la carte, full vendor, insurance, shared service, third-party, under warranty, and others. Among the 317 sites with one or more CT units, 192 sites provided information on servicing methods. For all reporting sites, the most common equipment servicing method for CT was full vendor support, with 131 (68.2%) sites reporting using this method, followed by third-party support with 51 (26.6%) sites reporting using this method. It should be noted that survey participants were asked to report these data at the modality level rather than the unit level. We received feedback from survey participants indicating that, at sites where there is more than one CT unit, different servicing agreements may be used for different units. The proportions of servicing methods by province and territory are shown in Table 20 (see also Table 97 and Table 98).
Table 20: Imaging Equipment Servicing Methods at Sites With CT Units by Province and Territory
| Province or territory | À la carte | Full vendor | Insurance | Shared service | Third-party | Under warranty | Other |
|---|---|---|---|---|---|---|---|
| Number of sites (%) | |||||||
| Alberta | 0 (0) | 36 (92.3) | 0 (0) | 0 (0) | 1 (2.6) | 0 (0) | 2 (5.1) |
| British Columbia | 0 (0) | 8 (21.1) | 0 (0) | 1 (2.6) | 27 (71.1) | 1 (2.6) | 1 (2.6) |
| Manitoba | 0 (0) | 7 (46.7) | 2 (13.3) | 0 (0) | 6 (40) | 0 (0) | 0 (0) |
| New Brunswick | 0 (0) | 5 (71.4) | 0 (0) | 0 (0) | 2 (28.6) | 0 (0) | 0 (0) |
| Newfoundland and Labrador | 0 (0) | 10 (76.9) | 0 (0) | 0 (0) | 2 (15.4) | 0 (0) | 1 (7.7) |
| Northwest Territories | 0 (0) | 1 (100) | 0 (0) | 0 (0) | 0 (0) | 0 (0) | 0 (0) |
| Nova Scotia | 0 (0) | 11 (100) | 0 (0) | 0 (0) | 0 (0) | 0 (0) | 0 (0) |
| Nunavut | NR | NR | NR | NR | NR | NR | NR |
| Ontario | 0 (0) | 24 (75) | 0 (0) | 1 (3.1) | 6 (18.8) | 1 (3.1) | 0 (0) |
| Prince Edward Island | 0 (0) | 2 (100) | 0 (0) | 0 (0) | 0 (100) | 0 (0) | 0 (0) |
| Quebec | 0 (0) | 19 (82.6) | 0 (0) | 0 (0) | 4 (17.4) | 0 (0) | 0 (0) |
| Saskatchewan | 0 (0) | 7 (70) | 0 (0) | 0 (0) | 3 (30) | 0 (0) | 0 (0) |
| Yukon | 0 (0) | 1 (100) | 0 (0) | 0 (0) | 0 (0) | 0 (0) | 0 (0) |
| Canada | 0 (0) | 131 (68.2) | 2 (1) | 2 (1) | 51 (26.6) | 2 (1) | 4 (2.1) |
CT = computed tomography; NR = not reported.
Note: Data derived from the survey question: “How is imaging equipment serviced?”
Technical Characteristics of CT Units
Information on the number of slices for CT units was available for 455 units at 371 sites. CT with 64 slices is the most common, with 211 (46.4%) units, followed by those with 128 slices, with 103 (22.6%) units, and 16 slices, with 56 (12.31%) units. A summary of CT slices is provided in Table 21.
Table 21: Reported Number of Slices in CT Units in 2019–2020
| Slice | 2019–2020 |
|---|---|
| Number (%) of units | |
| 1 | 7 (1.5) |
| 2 | 3 (0.7) |
| 4 | 6 (1.3) |
| 6 | 0 (0) |
| 8 | 5 (1.1) |
| 10 | 1 (0.2) |
| 16 | 56 (12.3) |
| 32 | 6 (1.3) |
| 40 | 1 (0.2) |
| 64 | 211 (46.4) |
| 128 | 103 (22.6) |
| 192 | 0 (0) |
| 256 | 19 (4.2) |
| 320 | 20 (4.4) |
| Other | 17 (3.7) |
CT = computed tomography.
Note: Data derived from the survey question: “How many multi-detectors does the CT unit have (how many slices)?”
Radiation Considerations for CT Units
The survey also asked about features intended to manage radiation safety. Information on dual-energy options was available for 414 units at 292 sites. Two hundred and seventy-five (66.4%) CT units have a dual-energy option, which allows for the simultaneous acquisition of images at two different energies, as a means of enhancing images and reducing radiation exposure. Information on dual-target options was available for 285 units. A dual-target option was available in 45 out of 285 (15.8%) CT units.
Two hundred and seventy-nine (86.6%) out of 322 CT units incorporate image reconstruction techniques for dose reduction, and 293 (95.8%) CT units record patient radiation dose by exam. Thirty-five (14.1%) out of 248 sites reported using cumulative radiation dose tracking, and 89 (72.4%) sites out of 126 reported plan to do this in the future. Two hundred and eighty-nine (88.1%) of 328 CT units were equipped with dose-management controls, and 249 (92.9%) of the survey respondents reported routine use of these controls. Data for the other sites were missing. Details are available in Table 86.
Projections of the Numbers of CT Units and Exams
To provide insight on the level of investment that may be required to meet ongoing demand for CT, this iteration of the CMII forecasts the potential demand for CT units and the volume of exams for the following years: 2025, 2030, 2035, and 2040.
The projections for number of units are shown in Figure 5 (see Table 99, for population projections and Table 100 for the projections of unit numbers). The projections are for three population scenarios: low, median, and high projected growth. Across all of Canada, the number of CT units is projected to be 648.9 (range 599.4 to 706.1) in 2040. In all provinces and territories, the number of CT units is projected to increase or stay the same for either median or high population growth, with the exception of Newfoundland and Labrador, which has a projected population decline in those scenarios. Ontario, for example, is projected to increase from 169 to 206 units, and Quebec from 164 to 180 units, both based on median estimated population growth. The three territories stay at one unit (values rounded). Newfoundland and Labrador is projected to decline from 15 to 14 units. When low population growth is assumed, the number of CT units are projected to increase in Prince Edward Island, Quebec, Ontario, Manitoba, Saskatchewan, Alberta, British Columbia, Yukon, Northwest Territories, and Nunavut, but not in Nova Scotia, Newfoundland and Labrador, and New Brunswick, which have a projected population decline.
Figure 5: Projected Number of CT Units for 2025, 2030, 2035, and 2040
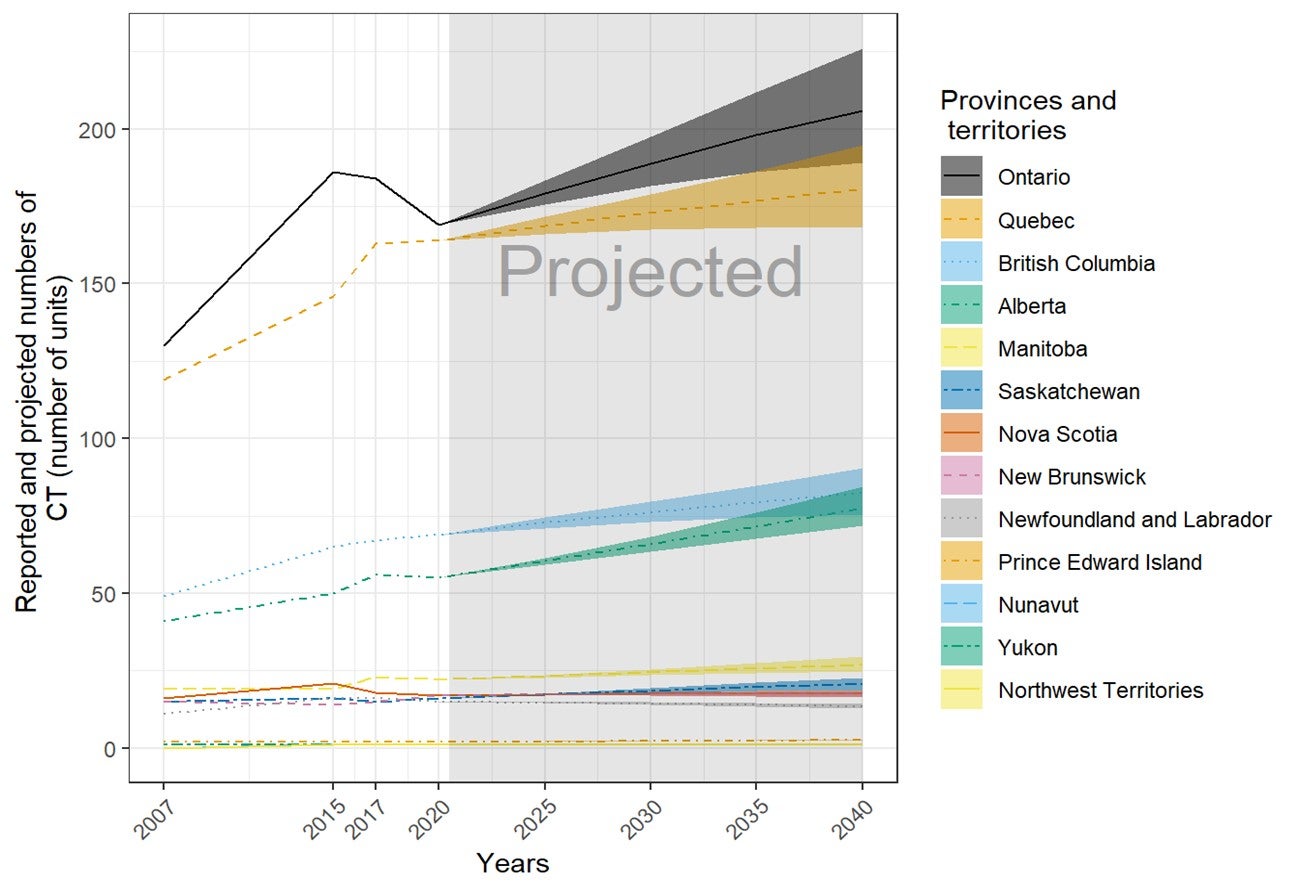
CT = computed tomography.
Note: The order of the provinces and territories is based on the number of CT (number of units) in 2040. The projections were calculated as the products of the numbers of per capita units in 2020 and the population projections in 2025, 2030, 2035, and 2040. The numbers of imaging units were provided by provincial or territorial validators in 2020. The population projections were retrieved from Statistics Canada website on January 6, 2020.23 The solid lines of projections were based on the population projection, assuming median growth. The upper and lower bounds were based on population projections assuming high and low growth, respectively.
The projections for number of examinations are shown in Figure 6 (see Table 101, for details). Across all of Canada, the number of CT exams is projected to increase to 6,414,142 (range 5,920,365 to 6,986,773) in 2040. In all provinces and territories, the number of CT exams is projected to increase or stay the same for either median or high population growth, with the exception of Newfoundland and Labrador, which has a projected population decline. Ontario, for example, is projected to show an increase in exams from 1,843,000 (rounded) to 2,249,400, and Quebec from 1,491,100 to 1,636,400, both based on median estimated population growth. Nunavut is projected to show an increase from 3,100 to 3,900 exams, and Yukon from 5,400 to 6,400 exams. Newfoundland and Labrador is projected to experience a decline from 99,000 to 89,100 exams. When low population growth is assumed, the number of CT units is projected to increase in Prince Edward Island, Quebec, Ontario, Manitoba, Saskatchewan, Alberta, British Columbia, Yukon, Northwest Territories, and Nunavut, but not in Nova Scotia, Newfoundland and Labrador, and New Brunswick, all of which have a projected population decline.
Figure 6: Projected Number of CT Examinations (Thousands) for 2025, 2030, 2035, 2040
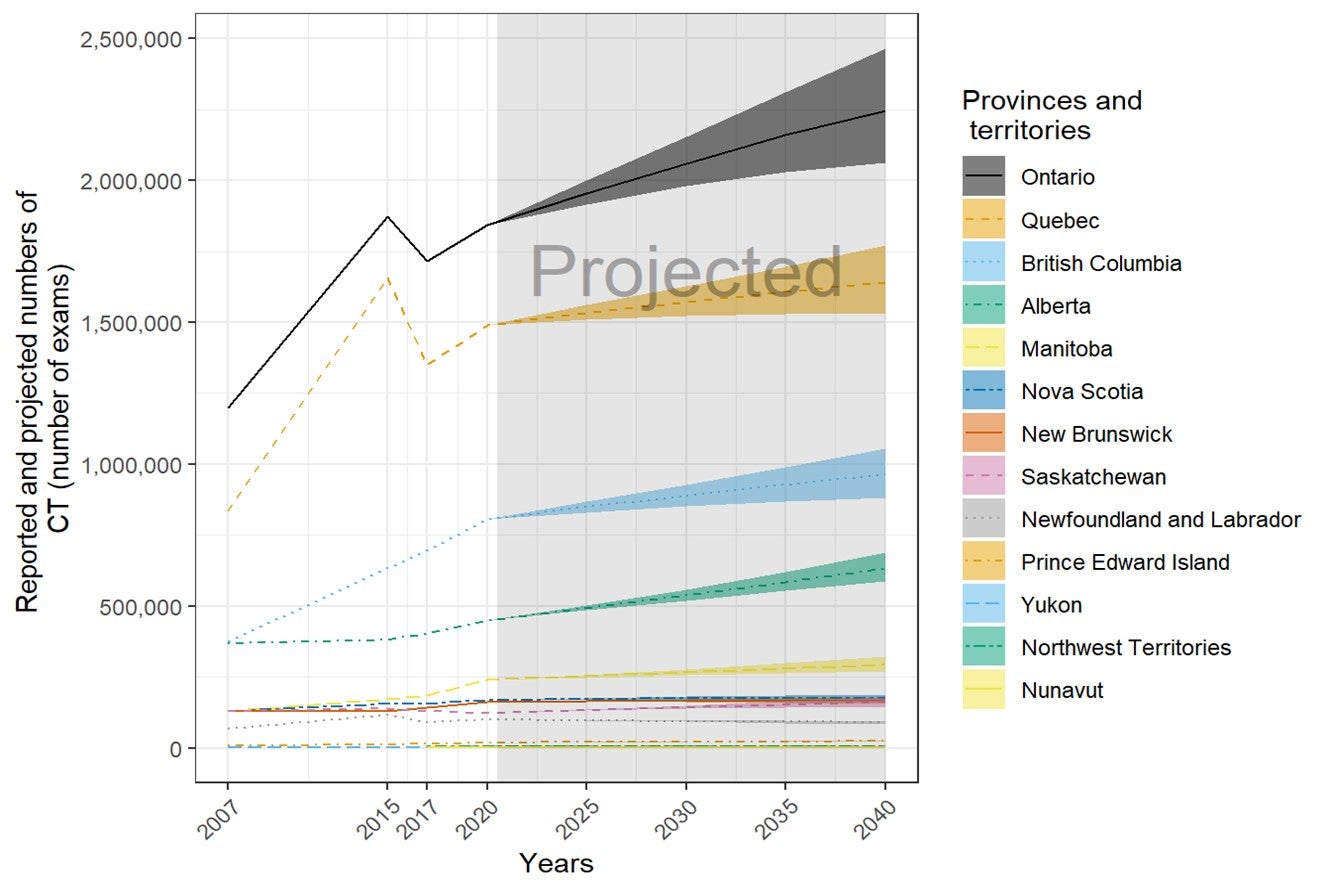
CT = computed tomography.
Note: The order of the provinces and territories is based on the number of CT (number of exams × 1,000) in 2040.
The projections were calculated as the products of the numbers of per capita exams in 2020 and the population projections in 2025, 2030, 2035, and 2040. The numbers of imaging exams were provided by provincial or territorial validators in 2020. The population projections were retrieved from Statistics Canada website on January 6, 2020.23 The solid lines of projections were based on the population projection, assuming median growth. The upper and lower bounds were based on population projections assuming high and low growth, respectively.
Magnetic Resonance Imaging
Number and Location of MRI Units
Two hundred and eighty-eight sites in 11 provinces or territories have one or more MRI units (mean 1.4 per site). There were up to eight units per site, for a total of 378 units (65 at free-standing sites). Ontario, Quebec, and British Columbia had the most MRI units. The number of units in all provinces or territories with the modality ranges from 0 to 24.4 per million population, but this does not reflect accessibility, particularly in provinces and territories with large remote areas.
One hundred and twenty-two MRI units were installed between 2015 and 2019–2020. Among the units with information, 23 were replacement for decommissioned units, 23 were new units, and 40 others were not specified as new or replacement. Twelve sites had decommissioned one or more MRI units (most decommissioned one unit) since the last survey in 2017, and 39 sites reported planned installations of one or more MRI units in the next two years (Table 22).
Table 22: Summary of Availability and Status of MRI Units by Province and Territory in 2019–2020
| Province or territory | Sites with availabilitya | Total unitsb (free-standing facilities) | Sites planning to install new or replacement unitsc | Sites decommissioning since 2017d | Units per million populatione |
|---|---|---|---|---|---|
| Alberta | 34 | 44 (13) | 9 | 3 | 10.0 |
| British Columbia | 46 | 52 (14) | 7 | 0 | 10.2 |
| Manitoba | 8 | 14 (0) | 1 | 1 | 10.2 |
| New Brunswick | 10 | 14 (1) | 1 | 2 | 17.9 |
| Newfoundland and Labrador | 5 | 5 (0) | 1 | 0 | 9.6 |
| Northwest Territories | 0 | 0 (0) | 0 | 0 | 0.0 |
| Nova Scotia | 10 | 11 (1) | 2 | 0 | 11.3 |
| Nunavut | 0 | 0 (0) | 0 | 0 | 0.0 |
| Ontario | 74 | 124 (8) | 13 | 2 | 8.5 |
| Prince Edward Island | 1 | 1 (0) | 0 | 0 | 6.3 |
| Quebec | 91 | 102 (26) | 1 | 4 | 12.0 |
| Saskatchewan | 8 | 10 (2) | 3 | 0 | 8.5 |
| Yukon | 1 | 1 (0) | 0 | 0 | 24.4 |
| Canada | 288 | 378 (65) | 38 | 12 | 10.0 |
MRI = magnetic resonance imaging.
a Data derived from number of units with technical details (make, model, first year of operation, and status as decommissioned/non-decommissioned), as provided by survey respondents to CMII and CIHI, and industry sources.
b Data obtained from provincial validators.
c Data derived from survey question: “Do you have plans to install the following in the next two years?”
d Data derived from survey question: “Have you decommissioned a [modality] unit since January 2, 2017?”
e The population (estimated) as of fourth quarter, 2019.24
f Provincial totals included private units.
Free-Standing Institutes
Overall, there are 65 MRI units at 60 free-standing institutes across Canada. Free-standing institutes were mostly identified as privately funded and are located in seven provinces, including Alberta, British Columbia, New Brunswick, Nova Scotia, Ontario, Quebec, and Saskatchewan. Most sites did not provide information on examinations per year, with only nine sites reporting this data.
Geographical Distribution of MRI
Figure 7 shows the geographical distribution of MRI units across Canada, mapped to the level of settlement (city or town), with circle diameter proportional to the number of units. Counts for all sites within a city/town were aggregated.
Figure 7: Geographic Distribution of MRI Units in Canadian Cities or Towns
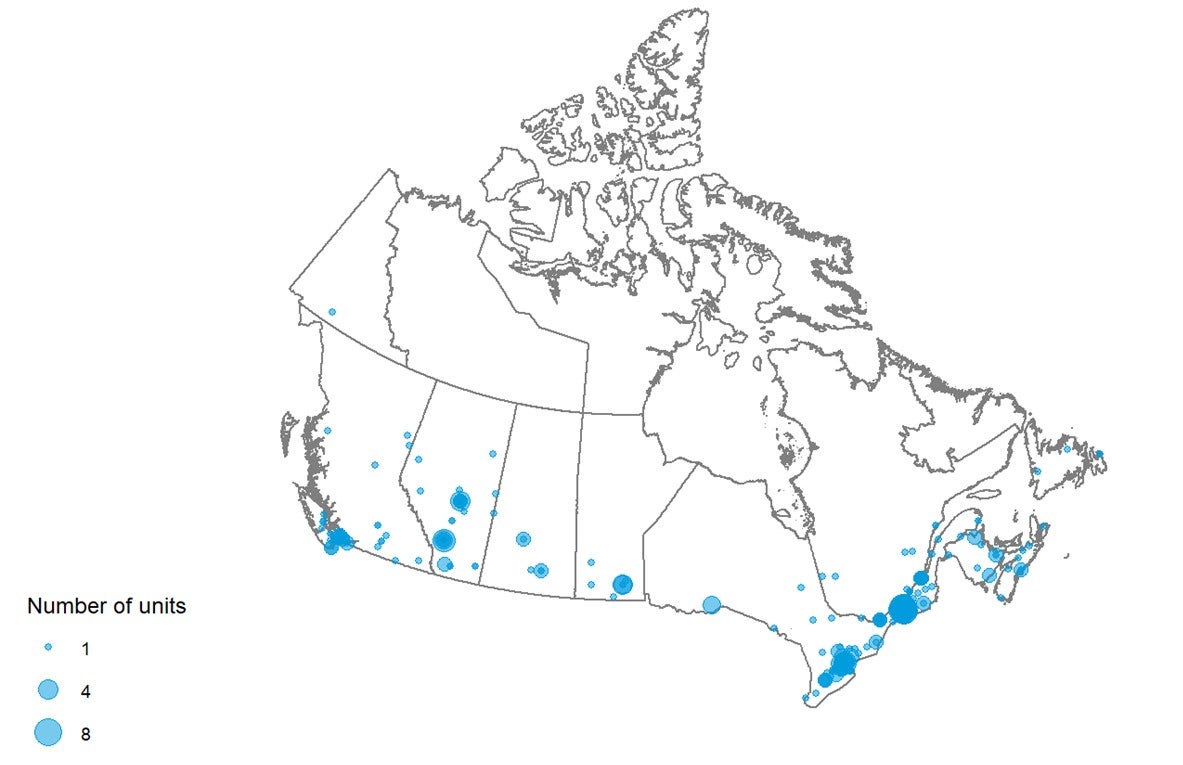
MRI = magnetic resonance imaging.
Availability and unit counts by site were derived from validator data; ; where these were unavailable, the data were from the survey.. Mobile units appear as one unit at each of the sites served.
Mobile MRI
Twenty sites indicated that they were served by mobile units, with two mobile units in British Columbia, two in Quebec, and one each in Alberta and New Brunswick.
Number of Examinations in a Fiscal Year
Across Canada, a total of 2,330,223 examinations per year were reported for 378 units. Data quoted were primarily supplied by provincial and territorial validators for either the latest fiscal year or calendar year and supplemented with data from free-standing sites. The average number of exams per unit was 6,164.6. Table 23 shows the total number of exams by province and territory and the number of exams per thousand people.
Table 23: Total Examinations per Fiscal Year Using MRI Units in 2019–2020
| Province or territory | Units with dataa (free-standing sites) | All unitsb | Total exams | Exams per unit | Populationc | Exams per thousand Population |
|---|---|---|---|---|---|---|
| Alberta | 44 (13) | 44 | 215,593d | 4,899.8 | 4,395,586 | 49.0 |
| British Columbia | 52 (14) | 52 | 255,038 | 4,904.6 | 5,105,576 | 50.0 |
| Manitoba | 14 (0) | 14 | 95,250 | 6,803.6 | 1,373,859 | 69.3 |
| New Brunswick | 14 (1) | 14 | 46,309c | 3,307.8 | 780,021 | 59.4 |
| Newfoundland and Labrador | 5 (0) | 5 | 21,929 c | 4,385.8 | 521,922 | 42.0 |
| Northwest Territories | 0 (0) | 0 | 0 | 0 | 44,895 | 0.0 |
| Nova Scotia | 11 (1) | 11 | 50,664 | 4,605.8 | 976,768 | 51.9 |
| Nunavut | 0 (0) | 0 | 0 | 0 | 38,873 | 0.0 |
| Ontario | 124 (8) | 124 | 1,107,814 | 8,934.0 | 14,659,616 | 75.6 |
| Prince Edward Island | 1 (0) | 1 | 5,348c | 5,348.0 | 157,901 | 33.9 |
| Quebec | 102 (26) | 102 | 448,130c | 4,393.4 | 8,522,800 | 52.6 |
| Saskatchewan | 10 (2) | 10 | 81,652c | 8,165.2 | 1,178,657 | 69.3 |
| Yukon | 1 (0) | 1 | 2,496 | 2,496.0 | 41,022 | 60.8 |
| Canada | 378 (65) | 378 | 2,330,223 | 6,164.6 | 37,797,496 | 61.6 |
MRI = magnetic resonance imaging.
a Data derived from number of units with technical details (make, model, first year of operation, and status as decommissioned/non-decommissioned).
b Data derived from the question: “For all [modality] units, how many examinations on average were conducted in the last fiscal year?”
c The population (estimated) as of fourth quarter.23
d Fiscal year 2018–2019.
Age of MRI Units by CMII Survey Years
There are 197 out of 378 (52.1%) imaging units with information on the first years of operation. Table 24 shows the first years of operation by the CMII survey year (2015, 2017, and 2020) and jurisdiction. There were 37 MRI units installed after the last CMII survey in 2017.
Table 24: First Years of Operation of the MRI Units by Province and Territory
| Province or territory | 2015 years and earlier | 2016 to 2017 years | 2018 to 2020 years | 2021 years and later | Total |
|---|---|---|---|---|---|
| Number (%) of currently operating units by first year of operation | |||||
| Alberta | 23 (82.1) | 3 (10.7) | 2 (7.1) | 0 (0) | 28 (100) |
| British Columbia | 17 (50) | 3 (8.8) | 14 (41.2) | 0 (0) | 34 (100) |
| Manitoba | 7 (70) | 3 (30) | 0 (0) | 0 (0) | 10 (100) |
| New Brunswick | 8 (88.9) | 0 (0) | 1 (11.1) | 0 (0) | 9 (100) |
| Newfoundland and Labrador | 1 (100) | 0 (0) | 0 (0) | 0 (0) | 1 (100) |
| Northwest Territories | NR | NR | NR | NR | NR |
| Nova Scotia | 7 (87.5) | 0 (0) | 1 (12.5) | 0 (0) | 8 (100) |
| Nunavut | NR | NR | NR | NR | NR |
| Ontario | 31 (73.8) | 5 (11.9) | 5 (11.9) | 1 (2.4) | 42 (100) |
| Prince Edward Island | NR | NR | NR | NR | NR |
| Quebec | 37 (63.8) | 8 (13.8) | 13 (22.4) | 0 (0) | 58 (100) |
| Saskatchewan | 5 (71.4) | 1 (14.3) | 1 (14.3) | 0 (0) | 7 (100) |
| Yukon | NR | NR | NR | NR | NR |
| Canada | 136 (69) | 23 (11.7) | 37 (18.8) | 1 (0.5) | 197 (100) |
MRI = magnetic resonance imaging; NR = not reported.
Note: Data derived from the survey question: “What year did (or will) the [modality] unit become operational?”
Full-Time Equivalent Medical Radiation Technologists for MRI Units
Survey participants were asked to provide information on the number of FTE MRTs assigned to all MRI units at the site level. An FTE position for an MRT is considered to amount to an eight-hour day, five days per week.
One hundred and eighteen of 214 sites (55.1%) with MRI units reported information. There are one to 25 FTE MRTs assigned per site. For sites that have a single MRI unit and a large number of MRTs assigned to that unit, survey respondents may have reported a total count at the facility level rather than the site level, the site may be located in densely populated area, and/or the MRI unit may be in operation 24 hours a day. The number of FTE MRTs per site by provinces and territories are shown in Table 25.
Table 25: Numbers of Full-time Equivalent Medical Radiation Technologists per Site for MRI Units by Province and Territory
| Province or territory | All sites with information | Total FTE MRTsa | FTE MRTs per million populationb | Average per site |
Minimal numbers per site |
Maximal numbers per site |
|---|---|---|---|---|---|---|
| Alberta | 20 | 121 | 27.5 | 6 | 2 | 17 |
| British Columbia | 24 | 159 | 31.1 | 6.6 | 2 | 17 |
| Manitoba | 8 | 67 | 48.8 | 8.4 | 3 | 25 |
| New Brunswick | 7 | 25 | 32.1 | 3.6 | 1 | 6 |
| Newfoundland and Labrador | 5 | 19 | 36.4 | 3.8 | 3 | 4 |
| Northwest Territories | NA | NA | NA | NA | NA | NA |
| Nova Scotia | 5 | 26 | 26.6 | 5.2 | 2 | 15 |
| Nunavut | NR | NR | NR | NR | NR | NR |
| Ontario | 24 | 190 | 13 | 7.9 | 1 | 15 |
| Prince Edward Island | 1 | 4 | 25.4 | 0 | 1 | 4 |
| Quebec | 17 | 88 | 10.3 | 5.2 | 1 | 12 |
| Saskatchewan | 6 | 48 | 40.7 | 8 | 2 | 18 |
| Yukon | 1 | 1 | 24.4 | 1 | 1 | 1 |
| Canada | 118 | 748 | 19.7 | 6.4 | 1 | 25 |
FTE = full-time equivalent; MRI = magnetic resonance imaging; MRT = medical radiation technologist; NA = not applicable; NR = not reported.
a Data derived from the survey question: “How many FTE technologists are assigned to all [modality] units (collective number of FTEs for all units)?”
b The population (estimated) as of fourth quarter, 2019.23
Typical Hours of Operation in a Week and Day, and All-Day and Weekend Use
Hours Per Day and 24-Hour Use for MRI Units
One hundred and seventy-three out of 403 publicly funded sites provided data for the average number of hours per day that MRI units were in use. Across all provinces or territories where a modality was available, MRI units were used for an average of 7.5 hours to 16.5 hours per day (Table 87). Twenty-six (15%) units were used for less than 8 hours per day, 39 (22.5%) units were used for eight to less than 12 hours per day, 85 (49.1%) units were used for 12 to less than 18 hours a day, and 23 (13.3%) units were used for more than 18 hours per day. Twenty-three (13.3%) sites reported that at least one unit at their site was used for 24 hours a day (Table 88).
Hours Per Week and Weekend Use for MRI Units
One hundred and seventy-three publicly funded sites provided data for the average number of hours per week that MRI units were in use. Across all provinces or territories where a modality was available, MRI units were used for an average of 37.5 hours to 113.2 hours per week. Twenty-five (14.5%) units were used for less than 20 hours per week, 29 (16.8%) units were used for 40 to less than 60 hours per week, 28 (16.2%) units were used for 60 to less than 80 hours per week, 59 (34.1%) units were used for 80 to less than 120 hours a week, and 32 (18.5%) units were used for more than 120 hours per week (Table 89). One hundred and eleven (64.2%) sites reported that at least one unit at their site was used at weekends (Table 90).
Planned and Unplanned Downtime for MRI Units
Among 213 sites with MRI units, 119 sites reported the planned and unplanned downtime in a year. The mean planned downtime was 33.9 hours, ranging from two to 168 hours per year. The mean unplanned downtime was 78.6 hours, ranging from 0 to 496 hours per year. At 48 sites, the planned downtime was less than unplanned downtime for 48 imaging units. Some commonly reported reasons for discrepancies between planned and unplanned downtime include catastrophic failure, equipment breakdown (especially in older equipment that may break down more frequently), mobile equipment that is logistically more challenging to support, difficulty sourcing parts, and waiting for parts. The distributions of planned and unplanned downtime for MRI units by jurisdiction are shown in Table 26.
Table 26: Annual Planned and Unplanned Downtime at Sites With MRI Units by Province and Territory
| Province or territory | Annual downtime – planned (hours) | Annual downtime – unplanned (hours) |
|---|---|---|
| Mean downtime, hours per year (n, range) | ||
| Alberta | 28.2 (24, 10 to 96) |
124.2 (24, 10 to 496) |
| British Columbia | 48.7 (18, 8 to 150) |
45.2 (10, 0 to 120) |
| Manitoba | 31.1 (8, 12 to 96) |
59 (7, 0 to 180) |
| New Brunswick | 27.7 (7, 16 to 72) |
73.1 (7, 20 to 185) |
| Newfoundland and Labrador | 28.4 (5, 24 to 46) |
19 (5, 16 to 21) |
| Northwest Territories | NA | NA |
| Nova Scotia | 33 (6, 12 to 72) |
44.1 (6, 12 to 80) |
| Nunavut | NA | NA |
| Ontario | 32.3 (24, 4 to 64) |
73.9 (14, 0 to 496) |
| Prince Edward Island | 7.5 (1, 7.5 to 7.5) | 15 (1, 15 to 15) |
| Quebec | 38.1 (18, 2 to 168) |
60.1 (13, 0 to 168) |
| Saskatchewan | 30 (7, 20 to 64) |
134.7 (5, 8 to 496) |
| Yukon | 10 (1, 10 to 10) |
10 (1, 10 to 10) |
| Canada | 33.8 (119, 2 to 168) |
77.7 (93, 0 to 496) |
MRI = magnetic resonance imaging; NA = not applicable.
Note: Data derived from the survey question: “How much planned downtime is anticipated for scheduled maintenance for all units in a given year? (expressed in hours)” and “How much unplanned downtime is experienced for all units in a given year? (expressed in hours).”
Types of MRI Use
Survey participants were asked to provide the overall percentage of use for cardiac exams, noncardiac exams, research, and any other type of use. Usage breakdown was available for 97 sites. On average, the highest mean percentage of use for MRI was noncardiac, at 92.9% (range 0% to 100%) followed by cardiac use, at 2.7% (range 0% to 50%), and research use, at 1.3% (range 0% to 50%). The percentages of cardiac, noncardiac, and research use are shown in Table 93).
Survey participants reported the overall percentage of use of MRI for diagnostic, interventional, and research purposes, as well as other type of use. Usage breakdown was available for 118 sites with any MRI units. On average, the highest mean percentage of use for MRI was diagnostic, at 98.7% (range 73% to 100%) followed by interventional use, at 0.6% (range 0% to 15%), and research use, at 0.6% (range 0% to 12%).
Data on the overall percentage of use by discipline for all MRI units were collected from survey participants. The categories included oncology, respiratory, hepatobiliary, musculoskeletal, inflammatory or infectious disease, neurological, cardiac, trauma, and other. Usage breakdown was available for 71 sites with MRI units. On average, the highest mean percentage of use for MRI for all available sites was 28.8% for neurological exams (use at individual sites ranged from 0% to 55%), followed by musculoskeletal exams, at 28.7% (range 0% to 70%), oncology, at 18.4% (range 0% to 100%), and hepatobiliary exams, at 12.3% (range 0% to 30%). Details are available in Table 94. Due to the low response rate, data may not be representative of all sites.
Clinical Decision Support Tools for MRI Units
Survey participants were asked to provide information on the adoption of CDST at the point of care by referring physicians ordering MRI exams. A CDST was described as a tool that provides real-time guidance to physicians on the appropriateness of diagnostic imaging tests for a given patient during the ordering process. Among the 111 sites with information on the use of CDSTs, 20 (18%) reported that referring physicians used CDSTs for MRI exams. The use of CDSTs by province or territory is summarized in Table 27.
Table 27: Use of Clinical Decision Support Tools at Sites with MRI Units by Imaging Modality
| Province or territory | CDST used | CDST not used | Total |
|---|---|---|---|
| Number of sites (%) | |||
| Alberta | 1 (4.2) | 23 (95.8) | 24 (100) |
| British Columbia | 10 (45.5) | 12 (54.5) | 22 (100) |
| Manitoba | 0 (0) | 8 (100) | 8 (100) |
| New Brunswick | 1 (20) | 4 (80) | 5 (100) |
| Newfoundland and Labrador | 0 (0) | 5 (100) | 5 (100) |
| Northwest Territories | NA | NA | NA |
| Nova Scotia | 1 (16.7) | 5 (83.3) | 6 (100) |
| Nunavut | NR | NR | NR |
| Ontario | 3 (15) | 17 (85) | 20 (100) |
| Prince Edward Island | NR | NR | NR |
| Quebec | 2 (15.4) | 11 (84.6) | 13 (100) |
| Saskatchewan | 2 (28.6) | 5 (71.4) | 7 (100) |
| Yukon | 0 (0) | 1 (100) | 1 (100) |
| Canada | 20 (18) | 91 (82) | 111 (100) |
CDST = clinical decision support tool; MRI = magnetic resonance imaging; NA = not applicable; NR= not reported.
Note: Data derived from the survey question: “Is a clinical decision support tool used at the point of care by medical professionals referring patients to medical imaging? A clinical decision support tool provides real-time guidance to physicians on the appropriateness of diagnostic imaging tests for a given patient during the ordering process.”
Use of Peer Review for MRI Images
Survey participants were asked to provide information on the use of peer review as a quality assurance tool for reading and interpreting images. Of the 112 sites that responded to the question as to whether MRI images were peer-reviewed, 70 (62.5%) responded “yes.” Alberta had the highest use of peer review, with 95%, followed by Ontario and British Columbia. The use of peer review at site level is summarized by province or territory in Table 28.
Table 28: Use of Peer Review for MRI Images, Summarized by Responding Province
| Province or territory | Conduct peer review | Do not conduct peer review | Total |
|---|---|---|---|
| Number of sites (%) | |||
| Alberta
|
23 (95.8)
|
1 (4.2)
|
24 (100)
|
| British Columbia
|
14 (66.7)
|
7 (33.3)
|
21 (100)
|
| Manitoba
|
0
|
8 (100)
|
8 (100)
|
| New Brunswick
|
2 (28.6)
|
5 (71.4)
|
7 (100)
|
| Newfoundland and Labrador
|
0
|
5 (100)
|
5 (100)
|
| Northwest Territories
|
NA
|
NA
|
NA
|
| Nova Scotia
|
4 (66.7)
|
2 (33.3)
|
6 (100)
|
| Nunavut
|
NA
|
NA
|
NA
|
| Ontario
|
17 (81)
|
4 (19)
|
21 (100)
|
| Prince Edward Island
|
NR
|
NR
|
NR
|
| Quebec
|
8 (57.1)
|
6 (42.9)
|
14 (100)
|
| Saskatchewan
|
2 (33.3)
|
4 (66.7)
|
6 (100)
|
| Yukon
|
NR
|
NR
|
NR
|
| Canada
|
70 (62.5)
|
42 (37.5)
|
112 (100)
|
NA = not applicable, NR = not reported.
Note: Data derived from the survey question: “Do radiologists at your facility participate in a peer review program for image reading and interpretation for the purpose of quality assurance?”
Integration of Artificial Intelligence for MRI
Survey participants were asked to report on the use of AI in the clinical and/or research setting for the following purposes: reading and interpreting images, reconstructing images, planning treatment, predicting outcomes, and carrying out administrative tasks. Most sites either did not respond to the questions on use of AI or answered with “no,” indicating that it was not used. Results for MRI are shown in Table 29.
Table 29: Summary of Use of AI in MRI
| Use of AI | Number of Sites / Number of Responses | Number of Sites Yes (%) | Clinical / Research / Both | Provinces (Number of Sites) |
|---|---|---|---|---|
| Is AI used in reading and interpreting images | 206 / 122 | 6a (2.9) | 4 / 2 / 0 | AB (1), BC (4), ON (1) |
| Is AI used in image reconstruction | 206 / 122 | 11a (5.3) | 8 / 1 / 2 | AB (1), BC (6), ON (2), QC (2) |
| Is AI used in treatment planning | 206 / 124 | 2a (1) | 1 / 1 / 0 | AB (1), QC (1) |
| Is AI used in predicting outcomes | 206 / 122 | 2a (1) | 1 / 1 / 0 | AB (1), ON (1) |
| Is AI used for administrative tasks | 206 / 120 | 2a (1) | 0 / 1/ 0 NR 1 |
AB (1), BC (1) |
AI = artificial intelligence; AB = Alberta; BC = British Columbia; MRI = magnetic resonance imaging; NR = not reported; ON = Ontario; QC = Quebec.
a One responded “no” but provided setting and/or specific comments on use for each question. It is included in this count.
Note: Question derived from the survey questions: “Is artificial intelligence used to support: The reading/interpretation of images? Predicting outcomes? Lower radiation dose? Image resolution/reconstruction enhancement? Treatment planning? Administrative tasks?”
Six sites (2.9%) in three provinces reported using AI for reading and interpreting MRI images; of these, four (1.9%) used AI in the clinical setting and two (1.0%) in the research setting. Specific clinical uses identified for AI were in voice recognition and breast imaging.
Eleven sites (5.3%) in four provinces reported using AI in MRI image reconstruction, eight in the clinical setting, two in both settings, and one in the research setting.
Two sites (1%) in two provinces reported using AI for treatment planning in MRI imaging in the clinical setting and in both settings. One of these sites reported its use for radiotherapy, oncology, and musculoskeletal imaging.
Two sites (1%) in two provinces reported using AI for predicting outcomes based on MRI images, in the clinical setting and in both settings.
Two sites (1%) in two provinces reported using AI for administrative tasks for MRI, one for the research setting and one for a setting not specified.
Exam-Ordering Practices at Sites with MRI Units
Survey participants were asked to report their use of various exam-ordering practices from the following options: requests by automated order entry, paper, fax, telephone, and centralized order entry for some, or all, exams. Among the 127 sites that provided a response to this question, the most common exam-ordering practice across Canada for MRI is paper and fax, at 99.2% of sites, followed by automated order entry, at 45.7% of sites. The use of exam-ordering practices is summarized by province and territory in Table 30.
Table 30: Exam-Ordering Practice at Sites with MRI Units by Province and Territory
| Province or territory | Automated entry forms | Paper forms | Requests – fax | Requests – telephone | Centralized booking – all exams | Centralized booking – some exams | ||||||
|---|---|---|---|---|---|---|---|---|---|---|---|---|
| Number (%) of sites that use these exam-ordering practices | ||||||||||||
| Yes | No | Yes | No | Yes | No | Yes | No | Yes | No | Yes | No | |
| Alberta | 21 (87.5) | 3 (12.5) | 24 (100) | 0 (0) | 24 (100) | 0 (0) | 6 (25) | 18 (75) | 2 (8.3) | 22 (91.7) | 14 (60.9) | 9 (39.1) |
| British Columbia | 14 (53.8) | 12 (46.2) | 26 (100) | 0 (0) | 26 (100) | 0 (0) | 7 (28) | 18 (72) | 11 (42.3) | 15 (57.7) | 17 (65.4) | 9 (34.6) |
| Manitoba | 1 (12.5) | 7 (87.5) | 8 (100) | 0 (0) | 8 (100) | 0 (0) | 3 (37.5) | 5 (62.5) | 4 (50) | 4 (50) | 0 (0) | 7 (100) |
| New Brunswick | 2 (28.6) | 5 (71.4) | 7 (100) | 0 (0) | 7 (100) | 0 (0) | 4 (57.1) | 3 (42.9) | 3 (42.9) | 4 (57.1) | 3 (42.9) | 4 (57.1) |
| Newfoundland and Labrador | 0 (0) | 5 (100) | 5 (100) | 0 (0) | 5 (100) | 0 (0) | 1 (20) | 4 (80) | 3 (75) | 1 (25) | 4 (80) | 1 (20) |
| Northwest Territories | NR | NR | NR | NR | NR | NR | NR | NR | NR | NR | NR | NR |
| Nova Scotia | 3 (42.9) | 4 (57.1) | 7 (100) | 0 (0) | 7 (100) | 0 (0) | 3 (42.9) | 4 (57.1) | 3 (42.9) | 4 (57.1) | 3 (50) | 3 (50) |
| Nunavut | NR | NR | NR | NR | NR | NR | NR | NR | NR | NR | NR | NR |
| Ontario | 12 (52.2) | 11 (47.8) | 22 (95.7) | 1 (4.3) | 22 (95.7) | 1 (4.3) | 5 (23.8) | 16 (76.2) | 14 (60.9) | 9 (39.1) | 11 (61.1) | 7 (38.9) |
| Prince Edward Island | 1 (3.0) | 0 (0) | 1 (70) | 0 (0) | 1 (27) | 0 (0) | 0 (0) | 1 (100) | 1 (100) | 1 (100) | 0 (0) | 10 (0) NR |
| Quebec | 4 (22.2) | 14 (77.8) | 18 (100) | 0 (0) | 18 (100) | 0 (0) | 1 (5.6) | 17 (94.4) | 7 (38.9) | 11 (61.1) | 4 (22.2) | 14 (77.8) |
| Saskatchewan | 0 (0) | 7 (100) | 7 (100) | 0 (0) | 6 (100) | 0 (0) | 2 (28.6) | 5 (71.4) | 5 (71.4) | 2 (28.6) | 1 (50) | 1 (50) |
| Yukon | 0 (0) | 1 (100) | 1 (100) | 0 (0) | 1 (100) | 0 (0) | 0 (0) | 1 (100) | 1 (100) | 0 (0) | 1 (100) | 0 (0) |
| Canada | 58 (45.7) |
69 (54.3) | 126 (99.2) | 1 (0.8) | 124 (99.2) | 1 (0.8) | 32 (25.8) | 92 (74.2) |
54 (42.9) | 72 (57.1) | 58 (51.3) | 55 (48.7) |
MRI = magnetic resonance imaging; NR = not reported.
Note: Data derived from the survey question: “Are automated order entry forms (exams request) used?”; “Are paper forms (exams requests) used?”; “Are requests received by fax?”; “Are requests received by phone?”; and “Is a centralized order entry (booking) system used? For all exams: yes/no; For some exams: yes/no.”
Exam-Ordering Privileges at Sites with MRI Units
Jurisdictional validators were asked to provide details on the exam-ordering privileges of various types of health care professionals working in the public setting. Responses are summarized in Table 31. Clinical specialists in all provinces and territories are authorized to order MRI exams, although some provinces restrict ordering privileges to specific types of specialists. Family physicians and general practitioners can order MRI exams in all provinces and territories, aside from those practising in Newfoundland and Labrador. In Prince Edward Island, family physicians and general practitioners can order MRI exams for some genetic disorders or when requested by a radiologist. Nurse practitioners in British Columbia, Alberta, Saskatchewan, Manitoba, New Brunswick, and Nova Scotia have MRI exams ordering privileges. In the Northwest Territories, nurse practitioners can order exams if a general practitioner co-signs the exam requisition.
In Saskatchewan, specifically in Saskatoon, all MRI exams orders require a radiologist consultation, unless ordered by a specialist physician. In Alberta, other allied health professionals may qualify to request MRI exams, depending on licensing and credentialing requirements. Medical students and residents, as well as physician assistants, can order MRI exams under the supervision of someone who has authorization privileges in Manitoba. The British Columbia validator noted that, although health care professionals, such as chiropractors, dentists, and podiatric surgeons, can order MRI exams, these exams may not necessarily be covered under the public medical services plan. No data were available for Quebec. As well, for New Brunswick, the responses came from one of the two regional health authorities, the Horizon Health Network.
Table 31: Types of Health Care Professionals With MRI Exam-Ordering Privileges
| Province or territory | Clinical specialists | Family physicians/general practitioners | Nurse practitioners |
|---|---|---|---|
|
Alberta |
Yes | Yes | Yes |
| Depending on licensing and credentialing, other allied health professionals may have qualifications to request MRI exams | |||
|
British Columbia |
Yes | Yes | Yes |
| Other: chiropractor, dentists, podiatric surgeon While a health care professional can order an MRI exam, it may not always be covered under a public medical services plan |
|||
|
Manitoba |
Yes | Yes | Yes |
| Health care learners (e.g., medical students, residents, and physician assistants) can order these tests under the supervision of someone who has authorization | |||
| New Brunswicka | Yes | Yes | Yes |
| Newfoundland and Labrador | Yes | No | No |
|
Northwest Territories |
Yes | Yes | No |
| Nurses can order exams if co-signed by a general practitioner | |||
| Nova Scotia | Yes | Yes | Yes |
| Nunavut | NA | NA | NA |
| Ontario | Yes | Yes | No |
| Specialty physicians and surgeons | |||
| Prince Edward Island | Yes | Yes | Yes |
| Health care learners (e.g., medical students, residents, and physician assistants) can order these tests under the supervision of someone who is authorized to order them | |||
| Quebec | NR | NR | NR |
| Saskatchewan | Yes | Yes | Yes |
| In Saskatoon only, a radiologist consultation is required unless ordered by a specialist physician | |||
| Yukon | Yes | Yes | Yes |
MRI = magnetic resonance imaging; NA = not applicable; NR = no response.
a Horizon Health.
Note: Data derived from the question: “Which health care professionals can order imaging exams for MRI?”
Imaging Equipment Servicing Methods at Sites with MRI Units
Survey participants were asked to report on methods for servicing imaging equipment. The servicing methods included à la carte, full vendor, insurance, shared service, third-party, under warranty, and others. Among the 213 sites with one or more MRI units, 125 provided information on servicing methods. For all reporting sites, the most commonly used equipment servicing method for MRI was full vendor support, with 88 (70.4%) sites reporting using this method, followed by third-party support, with 24 (19.2%) sites. It should be noted that survey participants were asked to report this data at the modality level rather than the unit level. We received feedback from survey participants indicating that, at sites where there was more than one MRI unit, different servicing agreements may be used for different units. The proportions of servicing methods by province and territory are shown in Table 32 (Table 97 and Table 98).
Table 32: Imaging Equipment Servicing Methods at Sites With MRI Units by Province and Territory
| Province or territory | À la carte | Full vendor | Insurance | Shared service | Third-party | Under warranty | Other |
|---|---|---|---|---|---|---|---|
| Number of sites (%) | |||||||
| Alberta | 0 (0) | 21 (91.3) | 0 (0) | 0 (0) | 0 (0) | 0 (0) | 2 (8.7) |
| British Columbia | 0 (0) | 11 (44) | 0 (0) | 2 (8) | 10 (40) | 1 (4) | 1 (4) |
| Manitoba | 0 (0) | 0 (0) | 4 (50) | 0 (0) | 3 (37.5) | 0 (0) | 1 (12.5) |
| New Brunswick | 0 (0) | 7 (100) | 0 (0) | 0 (0) | 0 (0) | 0 (0) | 0 (0) |
| Newfoundland and Labrador | 0 (0) | 4 (80) | 0 (0) | 0 (0) | 0 (0) | 0 (0) | 1 (20) |
| Northwest Territories | NR | NR | NR | NR | NR | NR | NR |
| Nova Scotia | 0 (0) | 9 (100) | 0 (0) | 0 (0) | 0 (0) | 0 (0) | 0 (0) |
| Nunavut | NR | NR | NR | NR | NR | NR | NR |
| Ontario | 0 (0) | 14 (63.6) | 0 (0) | 1 (4.5) | 7 (31.8) | 0 (0) | 0 (0) |
| Prince Edward Island | 0 (0) | 1 (100) | 0 (0) | 0 (0) | 0 (0) | 0 (0) | 0 (0) |
| Quebec | 0 (0) | 15 (88.2) | 0 (0) | 0 (0) | 2 (11.8) | 0 (0) | 0 (0) |
| Saskatchewan | 0 (0) | 5 (71.4) | 0 (0) | 0 (0) | 2 (28.6) | 0 (0) | 0 (0) |
| Yukon | 0 (0) | 1 (100) | 0 (0) | 0 (0) | 0 (0) | 0 (0) | 0 (0) |
| Canada | 0 (0) | 88 (70.4) | 4 (3.2) | 3 (2.4) | 24 (19.2) | 1 (0.8) | 5 (4) |
NR = not reported.
Note: Data derived from survey question: “How is imaging equipment serviced?”
Technical Characteristics of MRI Units
For all MRIs with available information on field strength (340 units), the majority of units (275 [80.9%]), operated with a 1.5 tesla (T) field strength. The second most common field strength was 3 T, with 58 (17.1%) units operating with this field strength. The remaining MRI units used field strengths of 0.3 T with one (0.3%) unit, 1 T with two (0.6%) units, 4 T with one (0.3%) unit, 5 T with one (0.3%) unit, 9.4 T with one (0.3%) unit, and other T, with one (0.3%) unit.
Data on MRI configuration were available for 240 units. The survey indicates 130 (54.2%) of MRI units use a closed bore (normal), 99 (41.2%) use closed bore (wide), and 11 (4.6%) use an open bore configuration.
Projections of the Numbers of MRI Units and Exams
To provide insight on the level of investment that may be required to meet ongoing demand for MRI, this iteration of the CMII forecasts the potential demand for MRI units and the volume of exams for the following years: 2025, 2030, 2035, and 2040.
The projections for number of units are shown in Figure 8 (see Table 99, for population projections and Table 102 for the projections of unit numbers). Three different population scenarios are envisioned, for low, median, and high projected growth. Across all of Canada, the number of MRI units is projected to be 450.5 (range 415.9 to 490.6) in 2040. In the provinces and territories with MRI units, the number of units is projected to increase or stay the same for either median or high population growth. Newfoundland and Labrador has a projected decrease in population growth in those scenarios, but rounding means that its estimated number of units does not decline. The number of units in Ontario, for example, is projected to increase from 124 to 151 units, and in Quebec, from 102 to 112 units, both based on median estimated population growth. As neither Nunavut nor the Northwest Territories currently have any MRI units, it was not possible to project change for those territories. When low population growth was assumed, the number of MRI units is projected to increase in Prince Edward Island, Quebec, Ontario, Manitoba, Saskatchewan, Alberta, British Columbia, and Yukon, but not in Nova Scotia, Newfoundland and Labrador, and New Brunswick, which have a projected population decline.
Figure 8: Projections of MRI Units for 2025, 2030, 2035, and 2040
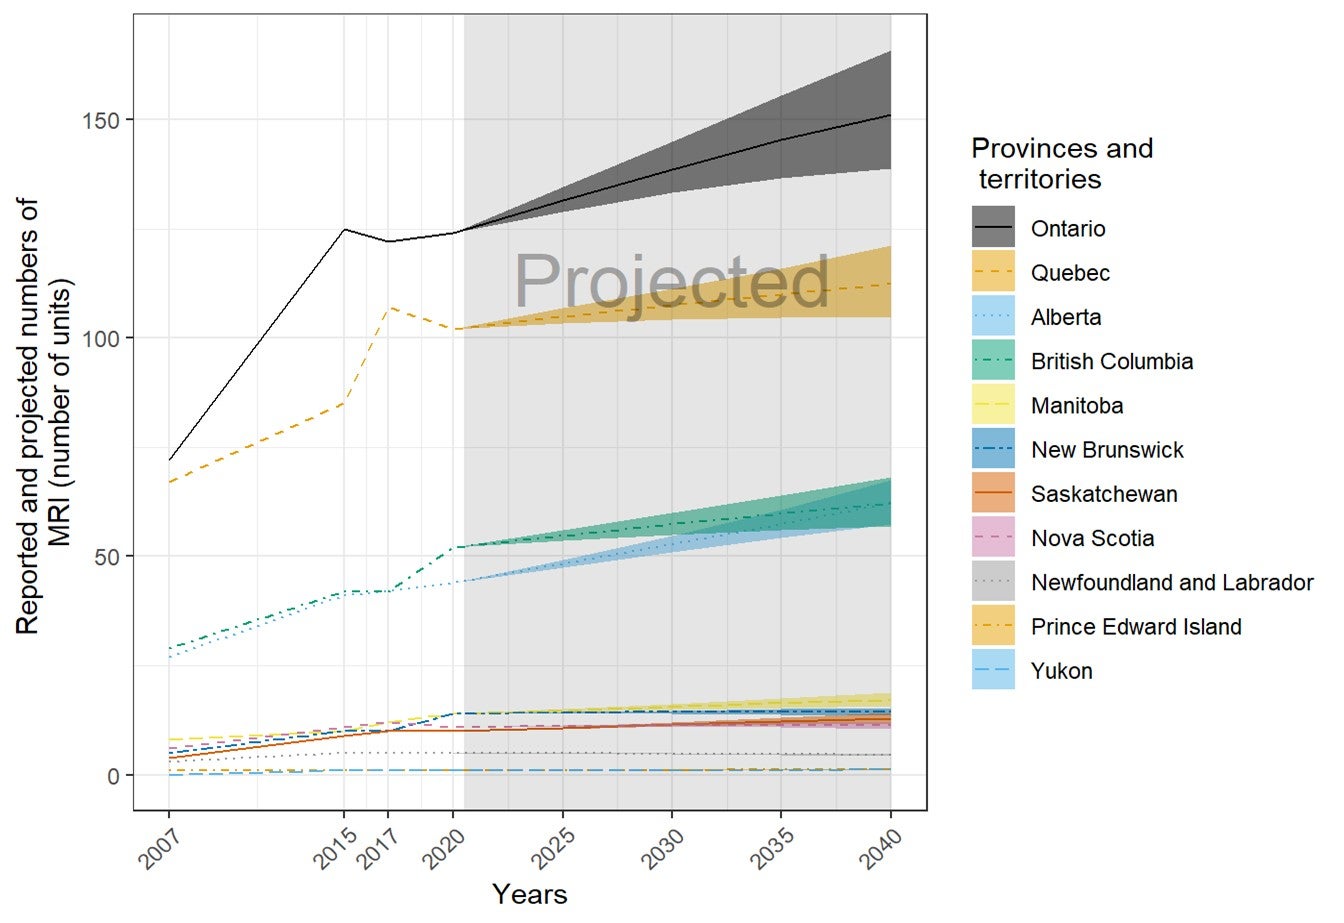
MRI = magnetic resonance imaging.
Note: The projection was calculated from the products of the numbers of per capita units or exams in 2019–2020 and the population projections in 2025, 2030, 2035, and 2040. The numbers of imaging units or exams were provided by provincial or territorial validators in 2020. The population projections were retrieved from Statistics Canada website on January 6, 2020.23 The solid lines of projections were based on the population projection assuming median growth. The upper and lower bounds were based on population projections, assuming high and low growth, respectively.
The projections for number of examinations are shown in Figure 9 (see Table 103, for details). Across all of Canada, the number of MRI exams is projected to be 2,804,680 (range 2,584,708 to 3,061,520) in 2040. In all provinces and territories with MRI units, the number of exams is projected to increase or stay the same for either median or high population growth, with the exception of Newfoundland and Labrador, which had a projected population decline. The number of exams in Ontario, for example, is projected to show an increase from 1,107,800 (rounded) to 1,352,000, and in Quebec, from 448,100 to 491,800, both based on median estimated population growth. The number of exams in Newfoundland and Labrador is projected to decline, from 21,900 to 19,800 exams. As the Yukon and Northwest Territories do not currently have any MRI units, it was not possible to project growth. When low population growth was assumed, the number of CT exams is projected to increase in Prince Edward Island, Quebec, Ontario, Manitoba, Saskatchewan, Alberta, British Columbia, and Yukon, but not in Nova Scotia, Newfoundland and Labrador, and New Brunswick, all of which have a projected population decline.
Figure 9: Projections of MRI Examinations (Thousands) for 2025, 2030, 2035, and 2040

MRI = magnetic resonance imaging.
Note: The projection was calculated from the products of the numbers of per capita units or exams in 2019–2020 and the population projections in 2025, 2030, 2035, and 2040. The numbers of imaging units or exams were provided by provincial or territorial validators in 2020. The population projections were retrieved from Statistics Canada website on January 6, 2020.23 The solid lines of projections were based on the population projection, assuming median growth. The upper and lower bounds were based on population projections, assuming high and low growth, respectively.
a For Nova Scotia, although the projected population will remain stable, significant growth has been identified in the Halifax Regional Municipality over the next 10 years.
AnchorPositron Emission Tomography–Computed Tomography or Positron Emission Tomography
Number and Location of PET-CT or PET Units
Forty-six sites in nine provinces have one or more PET-CT units (mean 1.2). There were up to two units per site, for a total of 57 (seven at free-standing sites) units. Quebec, Ontario, and Alberta had the most PET-CT units. The number of units in provinces or territories with the modality ranged from 0 per million population to 2.7 per million population, but this did not reflect accessibility, particularly in provinces and territories with large remote areas.
Thirteen PET-CT units were installed between 2015 and 2019–2020 (Table 9). Among the units with information, one was a replacement for a decommissioned unit, four were new units, and six others were not specified as new or replacement. No sites had decommissioned one or more PET-CT units since the last survey in 2017, and 18 sites reported planned installations of one or more PET-CT units in the next two years. In Ontario, five PET-CT units are used for research purposes only (Table 33).
Table 33: Summary of Availability and Status of PET-CT Units by Province in 2019–2020
| Province or territory | Sites with availabilitya | Total unitsb (free-standing facilities) | Sites planning to install new or replacement unitsc | Sites decommissioning since 2017d | Units per million populatione |
|---|---|---|---|---|---|
| Alberta | 3 | 4 (0) | 2 | 0 | 0.9 |
| British Columbia | 3 | 4 (1) | 2 | 0 | 0.8 |
| Manitoba | 1 | 1 (0) | 1 | 0 | 0.7 |
| New Brunswick | 2 | 2 (0) | 0 | 0 | 2.6 |
| Newfoundland and Labrador | 1 | 1 (0) | 0 | 0 | 1.9 |
| Nova Scotia | 1 | 1 (0) | 1 | 0 | 1.0 |
| Ontario | 16 | 20 (3) | 7 | 0 | 1.4 |
| Quebec | 18 | 23 (3) | 5 | 0 | 2.7 |
| Saskatchewan | 1 | 1 (0) | 0 | 0 | 0.8 |
| Nunavut | 0 | 0 (0) | 0 | 0 | 0.0 |
| Northwest Territories | 0 | 0 (0) | 0 | 0 | 0.0 |
| Prince Edward Island | 0 | 0 (0) | 0 | 0 | 0.0 |
| Yukon | 0 | 0 (0) | 0 | 0 | 0.0 |
| Canada | 46 | 57 (7) | 18 | 0 | 1.5 |
PET-CT = positron emission tomography–computed tomography.
a Data derived from number of units with technical details (make, model, first year of operation, and status as decommissioned/non-decommissioned), as provided by survey respondents to CMII and CIHI, and industry sources.
b Data obtained from provincial validators.
c Data derived from survey question: “Do you have plans to install the following in the next two years?”
d Data derived from survey question: “Have you decommissioned a [modality] unit since January 2, 2017?”
e The population (estimated) as of fourth quarter, 2019.23
Free-Standing Institutes
Overall, there are seven PET-CT units at five free-standing institutes across Canada. Free-standing institutes were mainly identified as privately funded and are located in three provinces, including British Columbia, Ontario, and Quebec. Most sites did not provide information on examinations per year, with only two sites reporting this data.
Geographical Distribution of PET-CT
Figure 10 shows the geographical distribution of PET-CT units across Canada, mapped to the level of settlement (city or town), with circle diameter proportional to the number of units. Counts for all sites within a city/town were aggregated.
Figure 10: Geographic Distribution of PET-CT Units in Canadian Cities or Towns
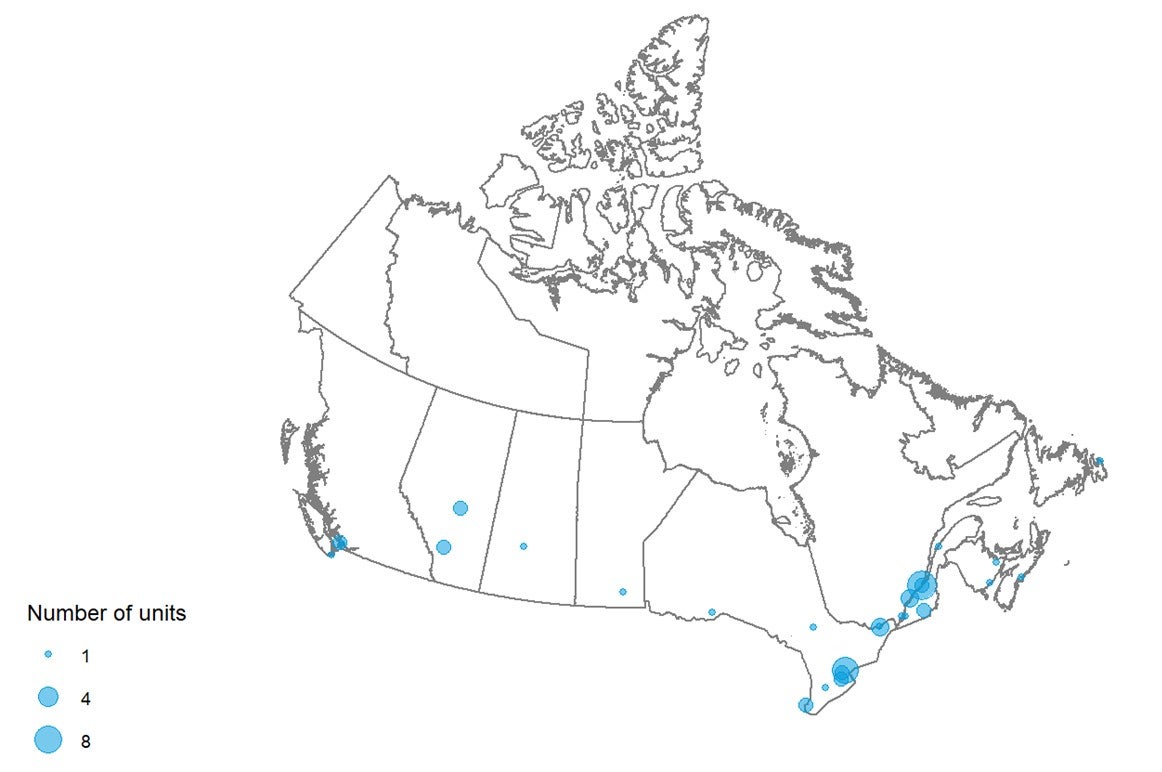
PET-CT = positron emission tomography–computed tomography. Availability and unit counts by site were derived from validator data; ; where these were unavailable, the data were from the survey.. Mobile units appear as one unit at each of the sites served.
Mobile PET-CT Units
One site indicated that it was served by a mobile unit in Ontario, although it was found to operate as a fixed unit.
Number of Examinations in a Fiscal Year
Across Canada, a total of 125,775 examinations per year were reported for 57 units. Data quoted were primarily supplied by provincial and territorial validators for either the latest fiscal year or calendar year and supplemented with data from free-standing sites. The average number of exams per unit was 2,206.6. Table 34 shows the recorded total number of exams by province and the number of exams per thousand people.
Table 34: Total Examinations per Fiscal Year Using PET-CT Units in 2019–2020
| Province or territory | Units with dataa (free-standing sites)a | All unitsb | Total exams | Exams per unit | Populationc | Exams per thousand population |
|---|---|---|---|---|---|---|
| Alberta | 4 (0) | 4 | 12,175d | 3,043.8 | 4,395,586 | 2.8 |
| British Columbia | 4 (1) | 4 | 11,286 | 2,821.5 | 5,105,576 | 2.2 |
| Manitoba | 1 (0) | 1 | 2,180 | 2,180.0 | 1,373,859 | 1.6 |
| New Brunswick | 2 (0) | 2 | 2,149c | 1,074.5 | 780,021 | 2.8 |
| Newfoundland and Labrador | 1 (0) | 1 | 1,704 c | 1,704.0 | 521,922 | 3.3 |
| Northwest Territories | 0 (0) | 0 | 0 | 0 | 44,895 | 0.0 |
| Nova Scotia | 1 (0) | 1 | 2,818 | 2,818.0 | 976,768 | 2.9 |
| Nunavut | 0 (0) | 0 | 0 | 0 | 38,873 | 0.0 |
| Ontario | 20 (3) | 20 | 23,564 | 1,178.2e | 14,659,616 | 1.6 |
| Prince Edward Island | 0 (0) | 0 | 0 | 0 | 157,901 | 0.0 |
| Quebec | 23 (3) | 23 | 67,849c | 2,950.0 | 8,522,800 | 8.0 |
| Saskatchewan | 1 (0) | 1 | 2,050 c | 2,050.0 | 1,178,657 | 1.7 |
| Yukon | 0 (0) | 0 | 0 | 0 | 41,022 | 0.0 |
| Canada | 57 (7) | 57 | 125,775 | 2,206.6 | 37,797,496 | 3.3 |
PET-CT = positron emission tomography–computed tomography.
a Data derived from number of units with technical details (make, model, first year of operation, and status as decommissioned/non-decommissioned).
b Data derived from the survey question: “For all [modality] units, how many examinations on average were conducted in the last fiscal year?”
d The population (estimated) as of fourth quarter, 2019.23
c Fiscal year 2018–2019.
e In Ontario, some units serve specialized populations (pediatrics, more remote communities) that perform fewer exams. Other sites can perform higher volumes of exams.
Age of PET-CT Units by CMII Survey Years
There are 37 out of 57 (64.9%) imaging units with information on the first years of operation. Table 35 shows the first years of operation by the CMII survey year (2015, 2017, and 2020) and jurisdiction. There were four PET-CT units installed after the last CMII survey in 2017.
Table 35: First Years of Operation of PET-CT Units by Province and Territory
| Province or territory | 2015 years and earlier | 2016 to 2017 years | 2018 to 2020 years | 2021 years and later | Total |
|---|---|---|---|---|---|
| Number of units (%) currently operation by first year of operation | |||||
| Alberta | 3 (100) | 0 (0) | 0 (0) | 0 (0) | 3 (100) |
| British Columbia | 3 (100) | 0 (0) | 0 (0) | 0 (0) | 3 (100) |
| Manitoba | 1 (100) | 0 (0) | 0 (0) | 0 (0) | 1 (100) |
| New Brunswick | 1 (100) | 0 (0) | 0 (0) | 0 (0) | 1 (100) |
| Newfoundland and Labrador | 0 (0) | 1 (100) | 0 (0) | 0 (0) | 1 (100) |
| Northwest Territories | NR | NR | NR | NR | NR |
| Nova Scotia | 1 (100) | 0 (0) | 0 (0) | 0 (0) | 1 (100) |
| Nunavut | NR | NR | NR | NR | NR |
| Ontario | 9 (75) | 0 (0) | 2 (16.7) | 1 (8.3) | 12 (100) |
| Prince Edward Island | NR | NR | NR | NR | NR |
| Quebec | 12 (85.7) | 0 (0) | 2 (14.3) | 0 (0) | 14 (100) |
| Saskatchewan | 1 (100) | 0 (0) | 0 (0) | 0 (0) | 1 (100) |
| Yukon | NR | NR | NR | NR | NR |
| Canada | 31 (83.8) | 1 (2.7) | 4 (10.8) | 1 (2.7) | 37 (100) |
NR = not reported; PET-CT = positron emission tomography–computed tomography.
Note: Data derived from the survey question: “What year did (or will) the [modality] unit become operational?”
Full-time Equivalent Medical Radiation Technologists for PET-CT Units
Survey participants were asked to provide information on the number of FTE MRTs assigned to all PET-CT units at the site level. An FTE position for an MRT is considered to amount to an eight-hour day, five days per week. Twenty-four of 44 sites with PET-CT units (54.5%) sites reported information (Table 36). There are one to 24 FTE MRTs assigned per site.
Table 36: Numbers of Full-time Equivalent Medical Radiation Technologists for PET-CT Units by Province
| Province or territory | All sites with information | Total FTE MRTs | Average per site | Minimal numbers per site | Maximal numbers per site |
|---|---|---|---|---|---|
| Alberta | 3 | 12 | 4 | 3 | 5 |
| British Columbia | 2 | 17 | 8.5 | 4 | 13 |
| Manitoba | 1 | 2 | 2 | 2 | 2 |
| New Brunswick | 2 | 5 | 2.5 | 2 | 3 |
| Newfoundland and Labrador | 1 | 3 | 3 | 3 | 3 |
| Northwest Territories | NA | NA | NA | NA | NA |
| Nova Scotia | 1 | 3 | 3 | 3 | 3 |
| Nunavut | NA | NA | NA | NA | NA |
| Ontario | 5 | 37 | 7.4 | 3 | 24 |
| Prince Edward Island | NR | NR | NR | NR | NR |
| Quebec | 8 | 35 | 4.4 | 1 | 9 |
| Saskatchewan | 1 | 8 | 8 | 8 | 8 |
| Yukon | NA | NA | NA | NA | NA |
| Canada | 24 | 122 | 5.1 | 1 | 24 |
FTE = full-time equivalent; MRT = medical radiation technologist; NA = not applicable; NR = not reported; PET-CT = positron emission tomography–computed tomography.
Note: Data derived from the survey question: “How many FTE technologists are assigned to all [modality] units (collective number of FTEs for all units)?”
Typical Hours of Operation in a Week and Day, and All-Day and Weekend Use
Hours Per Day and 24-Hour Use for PET-CT Units
Thirty-one out of 56 publicly funded sites provided data for the average number of hours per day that PET-CT units were in use. Across all provinces where the modality was available, PET-CT units were used for an average of seven to 12 hours per day (Table 87.) Twelve (38.7%) units were used for less than eight hours per day, 15 (48.4%) units were used for eight to less than 12 hours per day, four (12.9%) units were used for 12 to less than 18 hours a day, and no units were used for more than 18 hours per day (Table 88). It should be noted that the operating times of PET-CT units are closely tied to cyclotron supply operations, whether on- or off-site.
Hours Per Week and Weekend Use for PET-CT Units
Thirty out of 56 publicly funded sites provided data for the average number of hours per week that PET-CT units were in use. Across all provinces where a modality was available, PET-CT units were used for an average of 22 hours to 67.5 hours per week. Eleven (36.7%) units were used for less than 20 hours per week, 15 (50%) units were used for 40 to less than 60 hours per week, three (10%) units were used for 60 to less than 80 hours per week, one (3.3%) unit was used for 80 to less than 120 hours a week, and no units were used for more than 120 hours per week (Table 89). Three (10%) sites reported that at least one unit at their site was used on weekends (Table 90).
Planned and Unplanned Downtime for PET-CT Units
Among 46 sites with PET-CT units, 20 sites reported the planned and unplanned downtime in a year. The mean planned downtime was 56.1 hours, ranging from 0 to 505 hours per year. The mean unplanned downtime was 52.4 hours, ranging from 0 to 336 hours per year. At seven sites, the planned downtime was less than unplanned downtime for seven imaging units. Some commonly reported reasons for the discrepancies between planned and unplanned downtime include catastrophic failure, scanner breakdown, and cyclotron breakdown. The distributions of planned and unplanned downtime for PET-CT units by jurisdiction are shown in Table 37.
Table 37: Planned and Unplanned Downtime at Sites With PET-CT Units by Province
| Province or territory | Annual downtime – planned (hours) | Annual downtime – unplanned (hours) |
|---|---|---|
| Mean, hours per year (n, range) | ||
| Alberta | 22 (2, 20 to 24) |
82.5 (2, 30 to 135) |
| British Columbia | 90 (2, 90 to 90) |
20 (1, 20 to 20) |
| Manitoba | 16 (1, 16 to 16) |
20 (1, 20 to 20) |
| New Brunswick | 36 (2, 0 to 72) |
1.2 (2, 0 to 2.5) |
| Newfoundland and Labrador | 24 (1, 24 to 24) |
20 (1, 20 to 20) |
| Northwest Territories | NA | NA |
| Nova Scotia | 16 (1, 16 to 16) |
110.5 (1, 110.5 to 110.5) |
| Nunavut | NA | NA |
| Ontario | 78 (1, 78 to 78) |
50 (1, 50 to 50) |
| Prince Edward Island | NA | NA |
| Quebec | 20.9 (9, 1 to 56) |
23.9 (7, 5 to 49) |
| Saskatchewan | 505 (1, 505 to 505) |
336 (1, 336 to 336) |
| Yukon | NA | NA |
| Canada | 56.1 (20, 0 to 505) |
52.4 (17, 0 to 336) |
NA = not applicable; PET-CT = positron emission tomography–computed tomography.
Note: Data derived from the survey question: “How much planned downtime is anticipated for scheduled maintenance for all units in a given year? (expressed in hours)” and “How much unplanned downtime is experienced for all units in a given year? (expressed in hours).”
Types of PET-CT Use
Survey participants were asked to provide the overall percentage of use for cardiac exams, noncardiac exams, research, and any other type of use. Use breakdown was available for at 23 sites with PET-CT units. On average, the highest mean percentage of use for PET-CT was noncardiac, at 83.1% (range 19% to 100%) followed by cardiac use, at 10% (range 0% to 80%), and research use, at 6.5% (range 0% to 55%). Details are available in Table 93.
Survey participants reported the overall percentage of use for PET-CT for diagnostic, interventional, and research purposes, as well as other type of use. Use breakdown was available for 19 sites with PET-CT units. On average, the highest mean percentage of use for PET-CT was diagnostic, at 93.9% (range 45% to 100%) followed by interventional use, at 0.1% (range 0% to 2%), and research use, at 4.9% (range 0% to 55%).
Data on the overall percentage of use by discipline for all PET-CT units in their facilities was collected from survey participants. The categories included oncology, respiratory, hepatobiliary, musculoskeletal, inflammatory or infectious disease, neurological, cardiac, trauma, and other. Usage breakdown was available for 22 PET-CT sites. On average, the highest mean percentage of use for PET-CT for all available sites was exams for oncology, at 79.8% (use at individual sites ranged from 0% to 100%), followed by cardiac exams, at 11.8% (range 0% to 95%), neurological, at 5.7% (range 0% to 50%), and inflammatory exams, at 2.14% (range 0% to 15%). Details are available in Table 94. Due to the low response rate, data may not be representative of all sites.
Clinical Decision Support Tools for PET-CT Units
Survey participants were asked to provide information on the adoption of CDST at the point of care by referring physicians ordering PET-CT exams. A CDST was described as a tool that provides real-time guidance to physicians on the appropriateness of diagnostic imaging tests for a given patient during the ordering process. Among the 19 sites with PET-CT units and information on the use of CDSTs, five (26.3%) reported that referring physicians used CDSTs for ordering PET-CT exams. The use of CDSTs by province is listed in Table 38.
Table 38: Use of Clinical Decision Support Tools at Sites With PET-CT Units by Province and Territory
| Province or territory | CDST used | CDST not used | Total |
|---|---|---|---|
| Number of sites (%) | |||
| Alberta | 0 (0) | 3 (100) | 3 (100) |
| British Columbia | 2 (100) | 0 (0) | 2 (100) |
| Manitoba | 0 (0) | 1 (100) | 1 (100) |
| New Brunswick | 1 (100) | 0 (0) | 1 (100) |
| Newfoundland and Labrador | NR | NR | NR |
| Northwest Territories | NA | NA | NA |
| Nova Scotia | NR | NR | NR |
| Nunavut | NA | NA | NA |
| Ontarioa | 1 (33.3) | 2 (66.7) | 3 (100) |
| Prince Edward Island | NA | NA | NA |
| Quebec | 1 (12.5) | 7 (87.5) | 8 (100) |
| Saskatchewan | 0 (0) | 1 (100) | 1 (100) |
| Yukon | NA | NA | NA |
| Canada | 5 (26.3) | 14 (73.7) | 19 (100) |
CDST = clinical decision support tool; NA = not applicable; NR = not reported; PET-CT = positron emission tomography–computed tomography.
Note: Data derived from the survey question: “Is a clinical decision support tool used at the point of care by medical professionals referring patients to medical imaging? A clinical decision support tool provides real-time guidance to physicians on the appropriateness of diagnostic imaging tests for a given patient during the ordering process.”
a In Ontario, all publicly funded indications are evidence-based, and referral forms provide CDST. Sites with PET-CT may have additional direct referral layers within their systems.
Use of Peer Review of PET-CT Images
Survey participants were asked to provide information on the use of peer review as a quality assurance tool for reading and interpreting images. Of the 21 sites that responded to the question concerning whether PET-CT images were peer-reviewed, nine (42.9%) responded “yes.” British Columbia and Ontario had the highest rates of peer review. The use of peer review by province is summarized in Table 39.
Table 39: Use of Peer Review for PET-CT Images, Summarized by Province/Territory
| Province or territory | Conduct peer review | Do not conduct peer review | Total n (%) |
|---|---|---|---|
| Number of sites (%) | |||
| Alberta | 0 | 3 (100) | 4 (100) |
| British Columbia | 2 (100) | 0 | 2 (100) |
| Manitoba | 0 | 1 (100) | 1 (100) |
| New Brunswick | 1 (50) | 1 (50) | 2(100) |
| Newfoundland and Labrador | 0 | 1 (100) | 1 (100) |
| Northwest Territories | NA | NA | NA |
| Nova Scotia | NR | NR | NR |
| Nunavut | NA | NA | NA |
| Ontario | 2 (66.7) | 1 (33.3) | 3 (100) |
| Prince Edward Island | NA | NA | NA |
| Quebec | 4 (50) | 4 (50) | 8 (100) |
| Saskatchewan | 0 | 1 (100) | 1 (100) |
| Yukon | NA | NA | NA |
| Canada | 9 (42.9) | 12 (57.1) | 21 (100) |
NA = not applicable; NR = not reported; PET-CT = positron emission tomography–computed tomography.
Note: Data derived from the survey question: “Do radiologists at your facility participate in a peer review program for image reading and interpretation for the purpose of quality assurance?”
Integration of Use of Artificial Intelligence for PET-CT
Survey participants were asked to report on the use of AI in the clinical and/or research setting for the following purposes: lowering radiation dose, reading and interpreting images, reconstructing images, planning treatment, predicting outcomes, and carrying out administrative tasks. Only one province reported using AI for PET-CT imaging. Results for PET-CT are shown in Table 40.
Table 40: Summary of Use of AI in PET-CT
| Province or territory | Number of sites / number of responses | Number of sites – yes (%) | Clinical / research / both | Provinces (number of sites) |
|---|---|---|---|---|
| Is AI used in lowering radiation dose | 37 / 20 | 1 (2.7) | 0 / 0 / 1 | QC (1) |
| Is AI used in reading and interpreting images | 37 / 20 | 0 | 0 | – |
| Is AI used in image reconstruction | 37 / 20 | 3 (8.1) | 0 / 0 / 2 N |
QC (3) |
| Is AI used in treatment planning | 37 / 19 | 2 (5.4) | 2 / 0 / 0 | QC (2) |
| Is AI used in predicting outcomes | 37 / 20 | 0 | 0 | – |
| Is AI used for administrative tasks | 37 / 20 | 0 | 0 | – |
AI = artificial intelligence; NR = not reported; PET-CT = positron emission tomography–computed tomography; QC = Quebec.
Note: Data derived from the survey questions: “Is artificial intelligence used to support: The reading/interpretation of images? Predicting outcomes? Lower radiation dose? Image resolution/reconstruction enhancement? Treatment planning? Administrative tasks?”
At one site (2.7%), AI is used in lowering radiation dose in PET-CT imaging, in both clinical and research settings. Three sites (8.1%) reported using AI for image reconstruction, two in both a clinical and research setting, and one unreported. Two sites (5.4%) reported using AI in the clinical setting for treatment planning with PET-CT. No further details were available.
Exam-Ordering Practices at Sites with PET-CT Units
Survey participants were asked to report their use of various exam-ordering practices from the following options: requests by automated order entry, paper, fax, telephone, and centralized order entry for some, or all, exams. Among the 23 sites that provided a response to this question, the most common exam-ordering practice across Canada for PET-CT is paper and fax, at 100% of sites, followed by centralized order entry booking for some exams, at 65% of sites in provinces with PET-CT. The use of exam-ordering practices is summarized by province in Table 41.
Table 41: Exam-Ordering Practice at Sites with PET-CT Units by Province and Territory
| Automated entry forms | Paper forms | Requests – fax | Requests – telephone | Centralized booking – all exams | Centralized booking – some exams | |||||||
|---|---|---|---|---|---|---|---|---|---|---|---|---|
| Number (%) of sites that use these exam-ordering practices | ||||||||||||
| Yes | No | Yes | No | Yes | No | Yes | No | Yes | No | Yes | No | |
| Alberta | 3 (100) | 0 (0) | 3 (100) | 0 (0) | 3 (100) | 0 (0) | 0 (0) | 3 (100) | 0 (0) | 3 (100) | 3 (100) | 0 (0) |
| British Columbia | 0 (0) | 2 (100) | 2 (100) | 0 (0) | 2 (100) | 0 (0) | 0 (0) | 2 (100) | 2 (100) | 0 (0) | 2 (100) | 0 (0) |
| Manitoba | 0 (0) | 1 (100) | 1 (100) | 0 (0) | 1 (100) | 0 (0) | 0 (0) | 1 (100) | 0 (0) | 1 (100) | 0 (0) | 1 (100) |
| New Brunswick | 1 (50) | 1 (50) | 2 (100) | 0 (0) | 2 (100) | 0 (0) | 1 (50) | 1 (50) | 2 (100) | 0 (0) | 2 (100) | 0 (0) |
| Newfoundland and Labrador | 0 (0) | 1 (100) | 1 (100) | 0 (0) | 1 (100) | 0 (0) | 0 (0) | 1 (100) | 1 (100) | 0 (0) | 1 (100) | 0 (0) |
| Northwest Territories | NA | NA | NA | NA | NA | NA | NA | NA | NA | NA | NA | NA |
| Nova Scotia | 1 (100) | 0 (0) | 0 (0) | 0 (0) | 0 (0) | 0 (0) | 0 (0) | 0 (0) | 0 (0) | 0 (0) | 0 (0) | 0 (0) |
| Nunavut | NA | NA | NA | NA | NA | NA | NA | NA | NA | NA | NA | NA |
| Ontario | 2 (66.7) | 1 (33.3) | 3 (100) | 0 (0) | 3 (100) | 0 (0) | 1 (33.3) | 2 (66.7) | 2 (66.7) | 1 (33.3) | 2 (66.7) | 1 (33.3) |
| Prince Edward Island | NA | NA | NA | NA | NA | NA | NA | NA | NA | NA | NA | NA |
| Quebec | 2 (22.2) | 7 (77.8) | 9 (100) | 0 (0) | 9 (100) | 0 (0) | 2 (22.2) | 7 (77.8) | 3 (33.3) | 6 (66.7) | 3 (37.5) | 5 (62.5) |
| Saskatchewan | 0 (0) | 1 (100) | 1 (100) | 0 (0) | 1 (100) | 0 (0) | 0 (0) | 1 (100) | 1 (100) | 0 (0) | No data | No data |
| Yukon | NA | NA | NA | NA | NA | NA | NA | NA | NA | NA | NA | NA |
| Canada | 9 (39.1) | 14 (60.9) | 22 (100) | 0 (0) | 22 (100) | 0 (0) | 4 (18.2) | 18 (81.8) | 11 (50) | 11 (50) | 13 (65) | 7 (35) |
NA = not applicable; PET-CT = positron emission tomography–computed tomography.
Note: Data derived from the survey question: “Are automated order entry forms (exams request) used?”; “Are paper forms (exams requests) used?”; “Are requests received by fax?”; “Are requests received by phone?”; and “Is a centralized order entry (booking) system used? For all exams: Yes/no; For some exams: yes/no.”
Exam-Ordering Privileges at Sites with PET-CT Units
Jurisdictional validators were asked to provide details on the exam-ordering privileges of various types of health care professionals working in the public setting. Responses are summarized in Table 42. Clinical specialists in all provinces that operate PET-CT units are authorized to order PET-CT exams, although some provinces restrict ordering privileges to specific types of specialists, such as oncologists and surgeons. Family physicians and general practitioners can order PET-CT exams in Alberta and Ontario, although in Ontario this may not be common because most patients will have been seen by a specialist before being referred for a PET-CT exam. Nurse practitioners in Alberta have PET-CT exam-ordering privileges. In Manitoba, some other health care professionals can order these exams if they are under the guidance of an oncologist or surgeon.
No data were available for Quebec. As well, for New Brunswick, the responses came from one of the two regional health authorities, the Horizon Health Network.
Table 42: Types of Health Care Professionals That Have PET-CT Exam-Ordering Privileges
| Province or territory | Clinical specialists | Family physicians/ general practitioners | Nurse practitioners |
|---|---|---|---|
| Alberta | Yes | Yes | Yes |
| Depending on licensing and credentialing, other allied health professionals may have qualifications to request PET exams | |||
| British Columbia | Yes | No | No |
| PET-CT are currently under the sole governance of the BC Cancer Agency and primarily for oncology indications with limited use for cardiac indications | |||
| Manitoba | Yes oncologists, surgeons |
No | No |
| Other professionals can order PET exams if under the guidance of an oncologist or surgeon | |||
| New Brunswicka | Yes radiation oncologists, surgeons |
No | No |
| Newfoundland and Labrador | Yes mostly oncologists, endocrinologists, hematologists |
No | No |
| Northwest Territories | Yes | No | No |
| Nova Scotia | Yes Oncologists |
No | No |
| Ontario | Yes | Yes but rare given the publicly funded indications |
No |
| Prince Edward Island | NA | NA | NA |
| Quebec | NR | NR | NR |
| Saskatchewan | Yes | No | No |
| Yukon | NA | NA | NA |
NA = not applicable; NR = no response; PET-CT = positron emission tomography–computed tomography.
a Horizon Health.
Note: Data derived from the question: “Which health care professionals can order imaging exams for PET-CT?”
Imaging Equipment Servicing Methods at Sites with PET-CT Units
Survey participants were asked to report on methods of servicing imaging equipment. The servicing methods included à la carte, full vendor, insurance, shared service, third-party, under warranty, and others. Among the 46 sites with one or more PET-CT units, 22 provided information on servicing methods. For all reporting sites, the most commonly used equipment servicing method for PET-CT was full vendor support, with 14 (63.6%) sites reporting using this method, followed by third-party support, with four (18.2%) sites. It should be noted that survey participants were asked to report this data at the modality level rather than the unit level. We received feedback from survey participants indicating that, at sites where there was more than one PET-CT unit, different servicing agreements may be used for different units. Our survey did not accommodate for the differences between units. The proportions of servicing methods by province and territory are shown in Table 43 (Table 64).
Table 43: Imaging Equipment Servicing Methods at Sites With PET-CT Units by Province and Territory
| Province or territory | À la carte | Full vendor | Insurance | Shared service | Third-party | Under warranty | Other |
|---|---|---|---|---|---|---|---|
| Number of sites (%) | |||||||
| Alberta | 0 (0) | 2 (66.7) | 0 (0) | 0 (0) | 0 (0) | 0 (0) | 1 (33.3) |
| British Columbia | 0 (0) | 2 (100) | 0 (0) | 0 (0) | 0 (0) | 0 (0) | 0 (0) |
| Manitoba | 0 (0) | 0 (0) | 0 (0) | 1 (100) | 0 (0) | 0 (0) | 0 (0) |
| New Brunswick | 0 (0) | 2 (100) | 0 (0) | 0 (0) | 0 (0) | 0 (0) | 0 (0) |
| Newfoundland and Labrador | 0 (0) | 1 (100) | 0 (0) | 0 (0) | 0 (0) | 0 (0) | 0 (0) |
| Northwest Territories | NA | NA | NA | NA | NA | NA | NA |
| Nova Scotia | 0 (0) | 1 (100) | 0 (0) | 0 (0) | 0 (0) | 0 (0) | 0 (0) |
| Nunavut | NA | NA | NA | NA | NA | NA | NA |
| Ontario | 0 (0) | 1 (33.3) | 0 (0) | 0 (0) | 1 (33.3) | 1 (33.3) | 0 (0) |
| Prince Edward Island | NA | NA | NA | NA | NA | NA | NA |
| Quebec | 0 (0) | 4 (50) | 0 (0) | 0 (0) | 3 (37.5) | 1 (12.5) | 0 (0) |
| Saskatchewan | 0 (0) | 1 (100) | 0 (0) | 0 (0) | 0 (0) | 0 (0) | 0 (0) |
| Yukon | NA | NA | NA | NA | NA | NA | NA |
| Canada | 0 (0) | 14 (63.6) | 0 (0) | 1 (4.5) | 4 (18.2) | 2 (9.1) | 1 (4.5) |
NA = not applicable; PET-CT = positron emission tomography–computed tomography.
Note: Data derived from the survey question: “How is imaging equipment serviced?”
Technical Characteristics of PET-CT Units
The number of detector row slices available in the CT component of these PET-CT machines was available for 39 (69.6%) of the 56 units reported (Table 44). Sixteen slices were most commonly reported, in 20 (51.3%) units, followed by 64 slices, in 11 (28.2%) units. Among 27 PET-CT units with information on the imaging scope, six were used for near-whole body/full body and 21 for near-whole body. The CT component is used independently (i.e., to provide extra CT capacity) in 10 (30.3%) of 33 units that provided an answer to this question.
Table 44: Number of Slices of PET-CT Units
| PET-CT slices | Numbers of units (%) |
|---|---|
| 4 | 1 (2.6) |
| 16 | 20 (51.3) |
| 32 | 1 (2.6) |
| 40 | 2 (5.1) |
| 64 | 11 (28.2) |
| 128 | 2 (5.1) |
| 256 | 1 (2.6) |
| 320 | 1 (2.6) |
PET-CT = positron emission tomography–computed tomography.
Note: Data derived from the survey question: “How many slices does the CT component of the PET-CT unit have?”
Isotope Supply for PET-CT Units
We asked sites reporting a PET-CT whether they had access to a cyclotron, and, if not, where they obtained isotopes. Of the 31 PET-CT units with relevant information, nine had access to a local cyclotron. Twenty-two sites of the 31 sites without a cyclotron were required to obtain isotopes elsewhere. The Canadian Nuclear Safety Commission website identified a total of 21 PET cyclotrons in Canada.25
Isotope Use for PET-CT Units
Sites were asked to report on the different types of isotopes used for oncology, cardiology, neurology, and other purposes, and to differentiate between clinical and research use. Among 44 sites reporting on PET-CT units, 23 reported the use of radiotracers in 22 PET-CT units. The most common isotopes used for oncology were fluorine-18–fluorodeoxyglucose (18F-FDG), fluorine-18–sodium fluoride (18F-NaF). The summary of radiotracer use in PET-CT is shown in Table 45.
Table 45: Radiotracers for Clinical and Research Use in PET-CT Unit
| Radiotracers | Clinical use | Research use |
|---|---|---|
| Number of units with information | 23 | 14 |
| Number of sites (%) | ||
| Oncology | ||
| 18F-FDG (fluorine-18–fluorodeoxyglucose) | 22 (84.6) | 10 (71.4) |
| 18F-NaF (fluorine-18–sodium fluoride) | 6 (23.1) | 2 (14.3) |
| 18F-Choline (fluorine-18–choline) | 1 (3.8) | 2 (14.3) |
| 68Ga-DOTA-TATE (gallium-68–1,4,7,10-tetraazacyclododecane-1,4,7,10-tetraacetic acid-tyrosine-3-octreotate) |
1 (3.8) | 4 (28.6) |
| 18F-PSMA-1007 (fluorine-18–prostate-specific membrane antigen-1007) |
0 (0) | 2 (14.3) |
| 18F-FLT (fluorine-18–fluorothymidine) | 0 (0) | 1 (7.1) |
| 68Ga-PSMA-HBED-CC (simultaneous gallium-68–prostate-specific membrane antigen) | 0 (0) | 1 (7.1) |
| Cardiology | ||
| 13N-ammonia (nitrogen-13–ammonia) | 2 (7.7) | 2 (14.3) |
| 82Rb-chloride (rubidium-82–chloride) | 4 (15.4) | 1 (7.1) |
| Neurology | ||
| 18F-DOPA (fluorine-18–fluoro-dihydroxyphenylalanine) | 1 (3.8) | 1 (7.1) |
| 18F-Florbetaben (fluorine-18–florbetaben) | 5 (19.2) | 1 (7.1) |
| 18F-Flutemetamol (fluorine-18–flutemetamol) | 0 (0) | 1 (7.1) |
PET-CT = positron emission tomography–computed tomography.
Note: Data derived from the survey question: “Which radiotracers do you use for PET imaging? Divide answer into research and clinical purposes, plan to use in next 12 months.”
Radiation Considerations for PET-CT
The survey also asked about features intended to manage radiation safety. Information on the number of machines equipped with dose-management controls was available for 31 units, 28 (90.3%) of which had these controls (Table 86). Information on whether dose-management controls were used was available for 28 units, of which 24 (85.7%) use these controls. Data for the others were missing.
Information was available for 28 units on whether they incorporated reconstruction techniques for dose reduction. Twenty (71.4%) incorporate reconstruction techniques for dose reduction.
Information was available for 30 units on whether units recorded patient radiation dose per exam, and 26 (86.7%) reported that they did. Three (13%) out of 23 sites reported using cumulative radiation dose tracking, and eight (88%) sites out of nine reported plans to do this in the future.
Projections of the Numbers of PET-CT Units and Exams
To provide insight on the level of investment that may be required to meet ongoing demand for PET-CT, this iteration of the CMII forecasts the potential demand for PET-CT units and the volume of exams for the following years: 2025, 2030, 2035, and 2040.
The projections for number of units are shown in Figure 11 (see Table 99, for population projections and Table 104 for the projections of unit numbers). Three different population scenarios are envisioned, for low, median, and high projected growth. Across all of Canada, the number of PET-CT units is projected to be 66.6 (range 61.6 to 72.5) in 2040. In all provinces and territories with PET-CT units, the number of PET-CT units is projected to increase or stay the same for either median or high population growth. Newfoundland and Labrador has a projected population decline in those scenarios, but due to rounding, the projected number of units remains unchanged from 2020. The number of units in Ontario, for example, is projected to increase from 20 to 24 units, and in Quebec, from 23 to 25 units, both based on median estimated population growth. As the three territories and Prince Edward Island do not currently have any PET-CT units, it was not possible to project growth. When low population growth is assumed, the number of PET-CT units is projected to increase in Quebec, Ontario, Manitoba, Alberta, and British Columbia. Due to rounding, unit numbers in Saskatchewan, Nova Scotia, Newfoundland and Labrador, and New Brunswick, are projected to remain unchanged from 2020, although the latter three provinces have a projected population decline.
Figure 11: Projected Number of PET-CT Units for 2025, 2030, 2035, and 2040
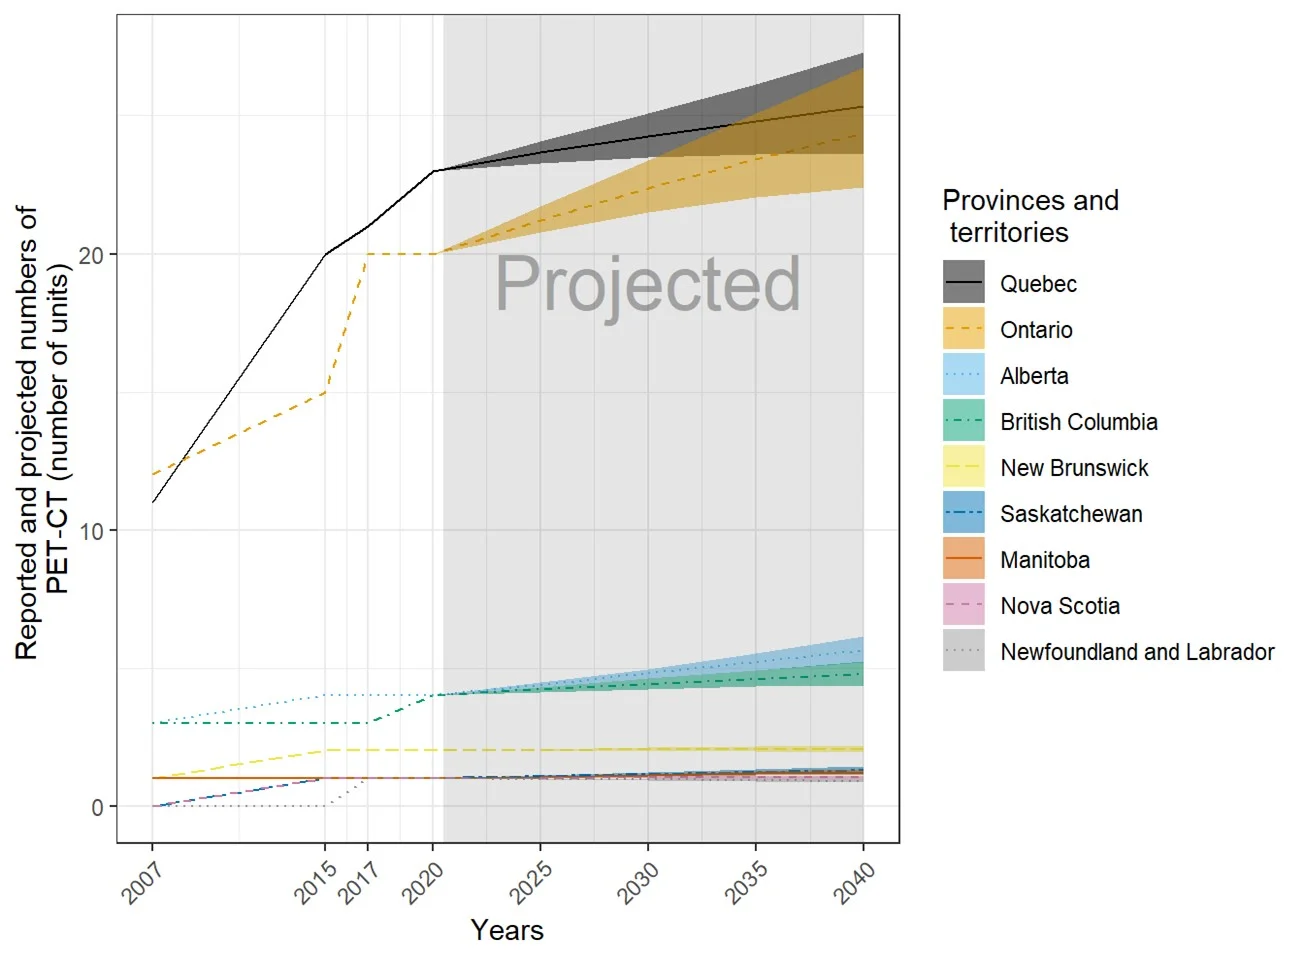
PET-CT = positron emission tomography–computed tomography.
The projection was calculated from the products of the numbers of per capita units or exams in 2020 and the population projections in 2025, 2030, 2035, and 2040. The numbers of imaging units or exams were provided by provincial or territorial validators in 2020. The population projections were retrieved from Statistics Canada website on January 6, 2020.23 The solid lines of projections were based on the population projection, assuming median growth. The upper and lower bounds were based on population projections, assuming high and low growth, respectively.
The projections for number of examinations are shown in Figure 12 (see Table 105, for details). Across all of Canada, the number of PET-CT exams is projected to increase to 146,091 (range 135,317 to 158,489) in 2040. In all provinces and territories with PET-CT units, the number of PET-CT exams is projected to increase or stay the same for either median or high population growth, with the exception of Newfoundland and Labrador, which has a projected population decline. In Ontario, for example, the number of exams is projected to increase from 23,600 (rounded) to 28,800, and in Quebec, from 67,800 to 74,500, both based on median estimated population growth. Newfoundland and Labrador is projected to decline from 1,700 to 1,500 exams. When low population growth was assumed, the number of PET-CT exams is projected to increase in Quebec, Ontario, Manitoba, Saskatchewan, Alberta, and British Columbia, but not in Nova Scotia, Newfoundland and Labrador, and New Brunswick, all of which have a projected population decline.
Figure 12: Projection of PET-CT Examinations (Thousands) for 2025, 2030, 2035, and 2040
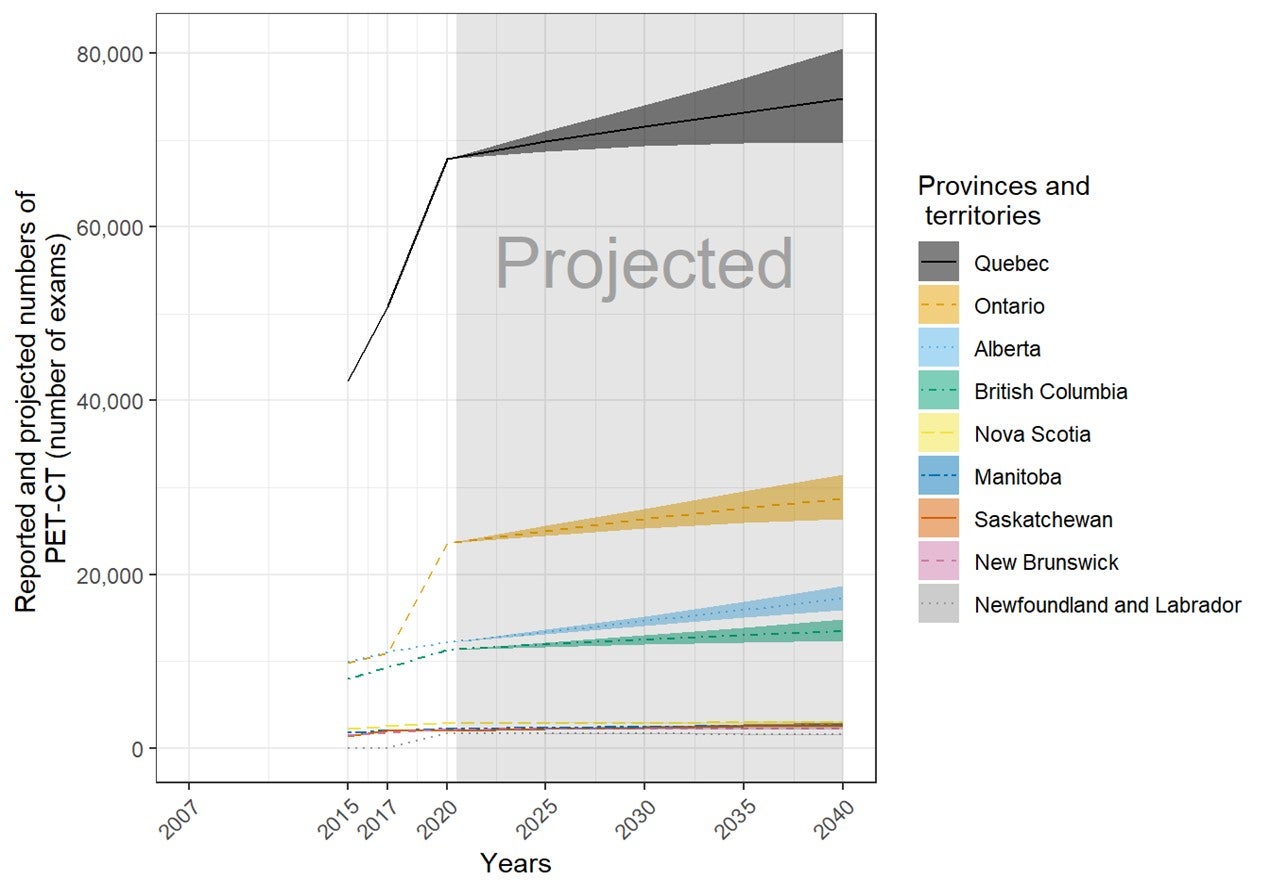
PET-CT = positron emission tomography–computed tomography.
The order of the provinces and territories is based on the number of SPECT (number of units) in 2040. The projection was calculated from the products of the numbers of per capita units or exams in 2020 and the population projections in 2025, 2030, 2035, and 2040. The numbers of imaging units or exams were provided by provincial or territorial validators in 2020. The population projections were retrieved from Statistics Canada website on January 6, 2020.23 The solid lines of projections were based on the population projection, assuming median growth. The upper and lower bounds were based on population projections, assuming high and low growth, respectively.
Positron Emission Tomography–MRI (PET-MRI)
Number and Location of PET-MRI Units
Four sites in Ontario and one site in Alberta have one PET-MRI unit each. The number of units in Ontario and Alberta were 0.2 per million population, each, but this did not reflect accessibility. Currently, PET-MRI is only used for research purposes in Canada.
Location of PET-MRI in Canada
Figure 13 shows the geographical distribution of PET-MRI units across Canada, mapped to the level of settlement (city or town), with circle diameter proportional to the number of units. Counts for all sites within a city/town were aggregated.
Figure 13: Geographic Distribution of PET-MRI Units in Canadian Cities or Towns
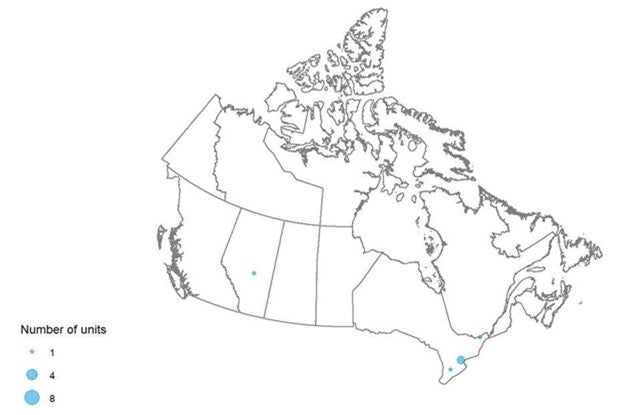
PET-MRI = positron emission tomography–magnetic resonance imaging.
Availability and unit counts by site were derived from validator data; where these were unavailable, the data were from the survey.. Mobile units appear as one unit at each of the sites served.
Patterns of PET-MRI Use: Number of Examinations in a Fiscal Year
Across Canada, a total of 1,200 examinations per year were reported for four units by Ontario for its last fiscal year. All PET-MRI units are used for research purposes only. The average number of exams per unit was 400 in Ontario.
Typical Hours of Operation in a Week and Day, and All-Day and Weekend Use
Hours Per Day and 24-Hour Use for PET-MRI Units
One out of the five publicly funded sites provided data for the average number of hours per day that PET-MRI units were in use. The PET-MRI unit was used for an average of seven hours per day. This unit was used for less than eight hours per day. No sites reported that any unit at their site was used for 24 hours a day (Table 88).
Hours Per Week and Weekend Use for PET-MRI Units
One out of the five publicly funded sites provided data for the average number of hours per week that a PET-MRI unit was in use. The PET-MRI unit was used for an average of 37.5 hours per week (Table 89). This unit was used for less than 40 hours per week. No sites reported any use on weekends (Table 90).
Single-Photon Emission Computed Tomography
Number and Location of SPECT Units
One hundred and seventy-four sites in nine provinces or territories have one or more SPECT units (mean 1.7 per site). There were up to nine units per site, for a total of 305 (41 at free-standing sites) units. Ontario, Quebec, and Alberta had the most SPECT units. The number of units in provinces or territories with the modality ranged from 0 to 14.1 per million population, but this did not reflect accessibility, particularly in provinces and territories with large remote areas.
Thirty-one SPECT units were installed between 2015 and 2020 (Table 9). Among the units with information, one was a replacement unit for a decommissioned unit, and 11 others were not specified as new or replacement. Eighteen sites had decommissioned one or more SPECT units (most decommissioned one unit) since the last survey in 2017, and 14 sites reported planned installations of one or more SPECT units in the next two years (Table 46).
Table 46: Summary of Availability and Status of SPECT Units by Province and Territory in 2020
| Province or territory | Sites with availabilitya | Total Unitsb (free-standing facilities) | Sites planning to install new or replacement unitsc | Sites decommissioning since 2017d | Units per million populatione |
|---|---|---|---|---|---|
| Alberta | 25 | 37 (27) | 0 | 1 | 8.4 |
| British Columbia | 19 | 24 (0) | 2 | 3 | 4.7 |
| Manitoba | 4 | 6 (0) | 0 | 1 | 4.4 |
| New Brunswick | 5 | 11 (0) | 1 | 0 | 14.1 |
| Newfoundland and Labrador | 3 | 3 (0) | 1 | 1 | 5.7 |
| Nova Scotia | 7 | 7 (0) | 1 | 1 | 7.2 |
| Ontario | 68 | 135 (14) | 8 | 9 | 9.2 |
| Prince Edward Island | 0 | 0 (0) | 0 | 0 | 0.0 |
| Quebec | 38 | 75 (0) | 0 | 2 | 8.8 |
| Saskatchewan | 4 | 7 (0) | 1 | 0 | 5.9 |
| Nunavut | 0 | 0 (0) | 0 | 0 | 0.0 |
| Northwest Territories | 0 | 0 (0) | 0 | 0 | 0.0 |
| Yukon | 0 | 0 (0) | 0 | 0 | 0.0 |
| Canada | 173 | 305 (41) | 14 | 18 | 8.1 |
SPECT = single-photon emission computed tomography.
a Data derived from number of units with technical details (make, model, first year of operation, and status as decommissioned/non-decommissioned), as provided by survey respondents to CMII and CIHI, and industry sources.
b Data obtained from provincial validators.
c Data derived from survey question: “Do you have plans to install the following in the next two years?”
d Data derived from survey question: “Have you decommissioned a [modality] unit since January 2, 2017?”
e The population (estimated) as of fourth quarter, 2019 (Table 4).23
Free-Standing Institutes
Overall, there are 41 SPECT units at 26 free-standing institutes across Canada. Free-standing institutes were mainly identified as privately funded and are located in two provinces, including Alberta and Ontario. Most sites did not provide information on examinations per year, with only three sites reporting this data.
Geographical Distribution of SPECT
Figure 14 shows the geographical distribution of SPECT units across Canada, mapped to the level of settlement (city or town), with circle diameter proportional to the number of units. Counts for all sites within a city/town were aggregated.
Figure 14: Geographic Distribution of SPECT Units in Canadian Cities or Towns

SPECT = single-photon emission computed tomography.
Availability and unit counts by site were derived from validator data; where these were unavailable, the data were from the survey. Mobile units appear as one unit at each of the sites served.
Mobile SPECT
Three sites indicated that they were served by mobile units in Ontario.
Number of Examinations in the Last Fiscal Year: SPECT
This report prefers validator-provided counts for units and exams. For SPECT and SPECT-CT, several jurisdictions reported combined exams. Therefore, combined SPECT and SPECT-CT exams are summarized in the section on SPECT-CT.
Age of SPECT Units by CMII Survey Years
There are 112 out of 305 (36.7%) imaging units with information on the first years of operation. Table 47 shows the first years of operation by the CMII survey year (2015, 2017, and 2020) and jurisdiction. There were 10 SPECT units installed after the last CMII survey in 2017.
Table 47: First Years of Operation of the SPECT Units by Province and Territory
| Province or territory | 2015 years and earlier | 2016 to 2017 years | 2018 to 2020 years | 2021 years and later | Total |
|---|---|---|---|---|---|
| Number (%) of currently units by first year of operation | |||||
| Alberta | 10 (100) | 0 (0) | 0 (0) | 0 (0) | 10 (100) |
| British Columbia | 13 (100) | 0 (0) | 0 (0) | 0 (0) | 13 (100) |
| Manitoba | 5 (100) | 0 (0) | 0 (0) | 0 (0) | 5 (100) |
| New Brunswick | 1 (25) | 0 (0) | 3 (75) | 0 (0) | 4 (100) |
| Newfoundland and Labrador | NR | NR | NR | NR | NR |
| Northwest Territories | NR | NR | NR | NR | NR |
| Nova Scotia | 5 (83.3) | 0 (0) | 1 (16.7) | 0 (0) | 6 (100) |
| Nunavut | NR | NR | NR | NR | NR |
| Ontario | 31 (96.9) | 0 (0) | 1 (3.1) | 0 (0) | 32 (100) |
| Prince Edward Island | NR | NR | NR | NR | NR |
| Quebec | 33 (80.5) | 3 (7.3) | 5 (12.2) | 0 (0) | 41 (100) |
| Saskatchewan | 1 (100) | 0 (0) | 0 (0) | 0 (0) | 1 (100) |
| Yukon | NR | NR | NR | NR | NR |
| Canada | 99 (88.4) | 3 (2.7) | 10 (8.9) | 0 (0) | 112 (100) |
NR = not reported; SPECT = single-photon emission computed tomography.
Note: Data derived from the survey question: “What year did (or will) the [modality] unit become operational?”
Full-Time Equivalent Medical Radiation Technologists for SPECT Units
The MRTs that work with SPECT and SPECT-CT are often the same staff. Therefore, FTE MRTS for combined SPECT and SPECT-CT are summarized in the section on SPECT-CT.
Typical Hours of Operation and All-Day and Weekend Use
Hours Per Day and 24-Hour Use for SPECT Units
Eighty-nine out of 173 publicly funded sites provided data for the average number of hours per day that SPECT units were in use. Across all provinces or territories where a modality was available, SPECT units were used for an average of seven hours to 9.6 hours per day (Table 87). Fifty-nine (55.1%) units were used for less than eight hours per day, 34 (38.2%) were used for eight to less than 12 hours per day, five (5.6%) units were used for 12 to less than 18 hours a day, and one (1.1%) unit was used for more than 18 hours per day. No sites reported 24-hour operations (Table 88).
Hours Per Week and Weekend Use for SPECT Units
Eighty-nine out of 173 publicly funded sites provided data for the average number of hours per week that SPECT units were in use. Across all provinces or territories where a modality was available, SPECT units were used for an average of 35 hours to 49.1 hours per week. Forty-nine (55.1%) units were used for less than 20 hours per week, 33 (37.1%) were used for 40 to less than 60 hours per week, six (6.7%) units were used for 60 to less than 80 hours per week, one (1.1%) unit was used for 80 to less than 120 hours a week, and no units were used for more than 120 hours per week (Table 89). Ten (11.2%) sites reported that at least one unit at their site was used on weekends (Table 90).
Planned and Unplanned Downtime for SPECT Units
Among 102 sites with SPECT units, 39 sites reported the planned and unplanned downtime in a year. The mean planned downtime was 30 hours, ranging from 4 to 120 hours per year. The mean unplanned downtime was 46.3 hours, ranging from 0 to 274 hours per year. At 17 sites, the planned downtime was less than unplanned downtime for 17 imaging units. Some commonly reported reasons for discrepancies between planned and unplanned downtime include catastrophic failure, scanner breakdown, older equipment breakdown, preventive maintenance, and the sourcing and delivery of replacement parts.
The distributions of planned and unplanned downtime for SPECT units by jurisdiction are shown in Table 48 (Table 91).
Table 48: Planned and Unplanned Downtime at Sites With SPECT Units by Province and Territory
| Province or territory | Annual downtime – planned (hours) | Annual downtime – unplanned (hours) |
|---|---|---|
| Mean, hours per year (n, range) | ||
| Alberta | 25.8 (8, 16 to 60) |
21.3 (7, 10 to 64) |
| British Columbia | 22.5 (8, 8 to 36) |
74 (6, 8 to 120) |
| Manitoba | 16 (1, 16 to 16) |
30 (1, 30 to 30) |
| New Brunswick | 34.7 (3, 8 to 72) |
31.3 (3, 24 to 40) |
| Newfoundland and Labrador | 55 (3, 21 to 120) |
63.3 (3, 0 to 140) |
| Northwest Territories | NA | NA |
| Nova Scotia | 49 (2, 16 to 82) |
55 (2, 30 to 80) |
| Nunavut | NA | NA |
| Ontario | 27.5 (8, 4 to 90) |
26 (7, 0 to 50) |
| Prince Edward Island | NA | NA |
| Quebec | 14.5 (2, 5 to 24) |
24.8 (2, 7.5 to 42) |
| Saskatchewan | 38 (4, 16 to 96) |
108.7 (3, 26 to 274) |
| Yukon | NA | NA |
| Canada | 30 (39, 4 to 120) |
46.3 (34, 0 to 274) |
NA = not applicable; SPECT = single-photon emission computed tomography.
Note: Data derived from survey question: “How much planned downtime is anticipated for scheduled maintenance for all units in a given year? (expressed in hours)” and “How much unplanned downtime is experienced for all units in a given year? (expressed in hours).”
Types of SPECT Use
Survey participants were asked to provide the overall percentage of use for cardiac exams, noncardiac exams, research, and any other type of use. Use breakdown was available for 55 sites with any SPECT units. On average, the highest mean percentage of use for SPECT was noncardiac, at 74% (range 0% to 100%), followed by cardiac use, at 25.7% (range 0% to 100%), and research use, at 0.3% (range 0% to 10%). Details are available in Table 93.
Survey participants reported the overall percentage of use for SPECT for diagnostic, interventional, and research purposes, as well as other type of use. Use breakdown was available for 45 sites with SPECT units. On average, the highest mean percentage of use for SPECT was diagnostic, at 98.6% (range 80% to 100%), followed by interventional use, at 0.4% (range 0% to 10%), and research use, at 0.5% (range 0% to 10%).
Data on the overall percentage of use by discipline for all SPECT units at the site level was collected from survey participants. The categories included oncology, respiratory, hepatobiliary, musculoskeletal, inflammatory or infectious disease, neurological, cardiac, trauma, and other. Usage breakdown was available for 36 SPECT sites. On average, the highest mean percentage of use for SPECT of all available sites was for cardiac exams, at 36.8% (use at individual sites ranged from 0% to 100%), followed by oncology exams, at 27.4% (range 0% to 100%), musculoskeletal, at 13.7% (range 0% to 50%), and respiratory exams, at 5.7% (range 0% to 65%). Details are available in Table 94. Due to the low response rate, data may not be representative of all sites.
Clinical Decision Support Tools for SPECT Units
Survey participants were asked to provide information on the adoption of CDST at the point of care by referring physicians ordering SPECT exams. A CDST was described as a tool that provides real-time guidance to physicians on the appropriateness of diagnostic imaging tests for a given patient during the ordering process. Among 48 sites with SPECT units and information on the use of CDSTs, one (2.1%) site reported that referring physicians use CDSTs for ordering SPECT exams. The use of CDSTs by province or territory is summarized in Table 49.
Table 49: Use of Clinical Decision Support Tools at Sites with SPECT Units by Province and Territory
| Province or territory | CDST used | CDST not used | Total |
|---|---|---|---|
| Number of sites (%) | |||
| Alberta
|
0 (0)
|
14 (100)
|
14 (100)
|
| British Columbia
|
0 (0)
|
11 (100)
|
11 (100)
|
| Manitoba
|
0 (0)
|
3 (100)
|
3 (100)
|
| New Brunswick
|
0 (0)
|
1 (100)
|
1 (100)
|
| Newfoundland and Labrador
|
0 (0)
|
2 (100)
|
2 (100)
|
| Northwest Territories
|
NA
|
NA
|
NA
|
| Nova Scotia
|
0 (0)
|
2 (100)
|
2 (100)
|
| Nunavut
|
NA
|
NA
|
NA
|
| Ontario
|
1 (9.1)
|
10 (90.9)
|
11 (100)
|
| Prince Edward Island
|
NA
|
NA
|
NA
|
| Quebec
|
0 (0)
|
1 (100)
|
1 (100)
|
| Saskatchewan
|
0 (0)
|
3 (100)
|
3 (100)
|
| Yukon
|
NA
|
NA
|
NA
|
| Canada
|
1 (2.1)
|
47 (97.9)
|
48 (100)
|
CDST = clinical decision support tool; NA = not applicable; SPECT = single-photon emission computed tomography.
Note: Data derived from the survey question: “Is a clinical decision support tool used at the point of care by medical professionals referring patients to medical imaging? A clinical decision support tool provides real-time guidance to physicians on the appropriateness of diagnostic imaging tests for a given patient during the ordering process.”
Use of Peer Review for SPECT Imaging
Survey participants were asked to provide information on the use of peer review as a quality assurance tool for reading and interpreting images. Of the 40 sites that responded to the question concerning whether SPECT images were peer-reviewed, 13 (32.5%) responded “yes.” The use of peer review by province or territory is shown in Table 50.
Table 50: Use of Peer Review for SPECT Images, Summarized by Province or Territory
| Province or territory | Conduct peer review | Do not conduct peer review | Total |
|---|---|---|---|
| Number of sites (%) | |||
| Alberta | 0 | 8 (100) | 8 (100) |
| British Columbia | 5 (50) | 5 (50) | 10 (100) |
| Manitoba | 0 | 3 (100) | 3 (100) |
| New Brunswick | 1 (33.3) | 2 (66.7) | 3 (100) |
| Newfoundland and Labrador | 0 | 3 (100) | 3 (100) |
| Northwest Territories | NA | NA | NA |
| Nova Scotia | 0 | 1 (100) | 1 (100) |
| Nunavut | NA | NA | NA |
| Ontario | 6 (66.7) | 3 (33.3) | 9 (100) |
| Prince Edward Island | NA | NA | NA |
| Quebec | 1 (100) | 0 | 1 (100) |
| Saskatchewan | 0 | 2 (100) | 2 (100) |
| Yukon | NA | NA | NA |
| Canada | 13 (32.5) | 27 (67.5) | 40 (100) |
NA = not applicable; SPECT = single-photon emission computed tomography.
Note: Derived from the rom survey question: “Do radiologists at your facility participate in a peer review program for image reading and interpretation for the purpose of quality assurance?”
Integration of Artificial Intelligence in SPECT Imaging
Survey participants were asked to report on the use of AI in the clinical and/or research setting for the following purposes: lowering radiation dose, reading and interpreting images, reconstructing images, planning treatment, predicting outcomes, and carrying out administrative tasks. Results for SPECT are shown in Table 51.
Table 51: Summary of Use of AI in SPECT
| Use of AI | Number of sites / number of responses | Number of sites – yes (%) | Clinical / research / both | Provinces (number of sites) |
|---|---|---|---|---|
| Is AI used in lowering radiation dose | 87 / 49 | 2 (2.3) | 0 / 0 / 2 | BC (1), ON (1) |
| Is AI used in reading and interpreting images | 87 / 50 | 3 (3.4) | 2 / 1 / 0 | BC (1), SK (2) |
| Is AI used in image reconstruction | 87 / 49 | 5a (5.7) | 5 / 0 / 0 | BC (1), NL (1), ON (2), QC (1) |
| Is AI used in treatment planning | 87 / 50 | 0 | 0 | – |
| Is AI used in predicting outcomes | 87 / 50 | 0 | 0 | – |
| Is AI used for administrative tasks | 87 / 48 | 1 (1.1) | NR 1 | BC (1) |
AI = artificial intelligence; BC = British Columbia; NL = Newfoundland and Labrador; NR = not reported; ON = Ontario; QC = Quebec SK = Saskatchewan; SPECT = single-photon emission computed tomography.
a One site responded “no” but provided setting and/or specific comments on use for each question. It is included in this count.
Note: Derived from the survey questions: “Is artificial intelligence used to support: The reading/interpretation of images? Predicting outcomes? Lower radiation dose? Image resolution/reconstruction enhancement? Treatment planning? Administrative tasks?”
Two sites (2.3%) in two provinces reported using AI in lowering radiation dose in SPECT imaging, in both clinical and research settings. Count recovery software was used to reduce dose and time in camera. Three sites (3.4%) in two provinces reported using AI for reading and interpreting SPECT images; of these, two (2.3%) used it in the clinical setting and one (1.1%) in the research setting. Five sites (4.6%) in four provinces reported using AI in SPECT image reconstruction, all in the clinical setting. One site (1.1%) reported using AI for SPECT administrative tasks, for an unreported setting. No further details were given.
Exam-Ordering Practices at Sites with SPECT Units
Survey participants were asked to report their use of various exam-ordering practices from the following options: requests by automated order entry, paper, fax, telephone, and centralized order entry for some, or all, exams. Among the 55 sites that provided a response to this question, the most common exam-ordering practice across Canada for SPECT is paper and fax, with a range of 95% to 100% of sites, followed by automated entry forms, at 56.4% of sites, and centralized order booking for some exams, at 56% of sites in provinces with SPECT. The use of exam-ordering practices is summarized by province or territory in Table 52 (Table 95 and Table 96).
Table 52: Exam-Ordering Practice at Sites with SPECT Units by Province and Territory
| Province or territory | Automated entry forms | Paper forms | Requests – fax | Requests – telephone | Centralized booking – all exams | Centralized booking – some exams | ||||||
|---|---|---|---|---|---|---|---|---|---|---|---|---|
| Number (%) of sites that use these exam-ordering practices | ||||||||||||
| Yes | No | Yes | No | Yes | No | Yes | No | Yes | No | Yes | No | |
| Alberta | 12 (92.3) | 1 (7.7) | 13 (100) | 0 (0) | 13 (100) | 0 (0) | 2 (15.4) | 11 (84.6) | 6 (46.2) | 7 (53.8) | 11 (84.6) | 2 (15.4) |
| British Columbia | 9 (64.3) | 5 (35.7) | 14 (100) | 0 (0) | 14 (100) | 0 (0) | 4 (28.6) | 10 (71.4) | 5 (35.7) | 9 (64.3) | 5 (38.5) | 8 (61.5) |
| Manitoba | 0 (0) | 3 (100) | 3 (100) | 0 (0) | 3 (100) | 0 (0) | 0 (0) | 2 (100) | 0 (0) | 3 (100) | 0 (0) | 3 (100) |
| New Brunswick | 1 (33.3) | 2 (66.7) | 3 (100) | 0 (0) | 3 (100) | 0 (0) | 1 (33.3) | 2 (66.7) | 2 (66.7) | 1 (33.3) | 3 (100) | 0 (0) |
| Newfoundland and Labrador | 1 (33.3) | 2 (66.7) | 3 (100) | 0 (0) | 3 (100) | 0 (0) | 0 (0) | 3 (100) | 2 (66.7) | 1 (33.3) | 2 (66.7) | 1 (33.3) |
| Northwest Territories | NA | NA | NA | NA | NA | NA | NA | NA | NA | NA | NA | NA |
| Nova Scotia | 1 (50) | 1 (50) | 2 (100) | 0 (0) | 2 (100) | 0 (0) | 2 (100) | 0 (0) | 0 (0) | 2 (100) | 1 (50) | 1 (50) |
| Nunavut | NA | NA | NA | NA | NA | NA | NA | NA | NA | NA | NA | NA |
| Ontario | 5 (45.5) | 6 (54.5) | 11 (100) | 0 (0) | 11 (100) | 0 (0) | 3 (27.3) | 8 (72.7) | 5 (45.5) | 6 (54.5) | 4 (40) | 6 (60) |
| Prince Edward Island | NA | NA | NA | NA | NA | NA | NA | NA | NA | NA | NA | NA |
| Quebec | 0 (0) | 2 (100) | 2 (100) | 0 (0) | 2 (100) | 0 (0) | 0 (0) | 2 (100) | 2 (100) | 0 (0) | 2 (100) | 0 (0) |
| Saskatchewan | 2 (50) | 2 (50) | 4 (100) | 0 (0) | 3 (75) | 1 (25) | 2 (66.7) | 1 (33.3) | 3 (100) | 0 (0) | 0 (0) | 1 (100) |
| Yukon | NA | NA | NA | NA | NA | NA | NA | NA | NA | NA | NA | NA |
| Canada | 31 (56.4) | 24 (43.6) | 55 (100) | 0 (0) | 54 (98.2) | 1 (1.8) | 14 (26.4) | 39 (73.6) | 25 (46.3) | 29 (53.7) | 28 (56) | 22 (44) |
NA = not applicable; SPECT = single-photon emission computed tomography.
Note: Data derived from the survey question: “Are automated order entry forms (exams request) used?”; “Are paper forms (exams requests) used?”; “Are requests received by fax?”; “Are requests received by phone?”; and “Is a centralized order entry (booking) system used? For all exams: Yes/no; For some exams: yes/no.”
Imaging Equipment Servicing Methods at Sites With SPECT Units
Survey participants were asked to report on methods for servicing imaging equipment. The servicing methods included à la carte, full vendor, insurance, shared service, third-party, under warranty, and others. Among the 173 sites with any SPECT units, 55 sites provided information on servicing methods. For all reporting sites, the most commonly used equipment servicing method for SPECT was full vendor support, with, 31 (56.3%) sites reporting using this method, followed by third-party support, 14 (25.5%). It should be noted that survey participants were asked to report this data at the modality level rather than the unit level. We received feedback from survey participants indicating that, at sites where there was more than one unit, different servicing agreements may be used for different units. The proportions of servicing methods by province and territory are shown in Table 53.
Table 53: Imaging Equipment Servicing Methods at Sites with SPECT Units by Province and Territory
| Province or territory | À la carte | Full vendor | Insurance | Shared service | Third-party | Under warranty | Other |
|---|---|---|---|---|---|---|---|
|
Number of sites (%) |
|||||||
| Alberta | 0 (0) | 5 (62.5) | 0 (0) | 0 (0) | 3 (37.5) | 0 (0) | 0 (0) |
| British Columbia | 2 (14.3) | 2 (14.3) | 0 (0) | 1 (7.1) | 8 (57.1) | 1 (7.1) | 0 (0) |
| Manitoba | 0 (0) | 0 (0) | 0 (0) | 3 (100) | 0 (0) | 0 (0) | 0 (0) |
| New Brunswick | 0 (0) | 3 (100) | 0 (0) | 0 (0) | 0 (0) | 0 (0) | 0 (0) |
| Newfoundland and Labrador | 0 (0) | 3 (100) | 0 (0) | 0 (0) | 0 (0) | 0 (0) | 0 (0) |
| Northwest Territories | NA | NA | NA | NA | NA | NA | NA |
| Nova Scotia | 0 (0) | 7 (100) | 0 (0) | 0 (0) | 0 (0) | 0 (0) | 0 (0) |
| Nunavut | NA | NA | NA | NA | NA | NA | NA |
| Ontario | 0 (0) | 7 (63.6) | 0 (0) | 2 (18.2) | 1 (9.1) | 1 (9.1) | 0 (0) |
| Prince Edward Island | NA | NA | NA | NA | NA | NA | NA |
| Quebec | 0 (0) | 2 (100) | 0 (0) | 0 (0) | 0 (0) | 0 (0) | 0 (0) |
| Saskatchewan | 0 (0) | 2 (50) | 0 (0) | 0 (0) | 2 (50) | 0 (0) | 0 (0) |
| Yukon | NA | NA | NA | NA | NA | NA | NA |
| Canada | 2 (3.6) | 31 (56.3) | 0 (0) | 6 (10.9) | 14 (25.5) | 2 (3.6) | 0 (0) |
NA = not applicable; SPECT = single-photon emission computed tomography.
Note: Data derived from survey question: “How is imaging equipment serviced?”
Technical Characteristics of SPECT Units
The number of detector heads was reported for 116 units, with two detector heads being the most common configuration in 91 (78.4%) units, followed by one in 21 (17.2%) units, and three in 5 (4.3%) units. CT capability of one- to 64-slice resolution was reported for 49 (66.2%) of the 74 units with relevant information. Of the 125 units with the information available, 31 (24.8%) were dedicated cardiac imaging units, with the remaining 94 (75.2%) having multi-purpose or noncardiac use. The field of view was reported for 107 units, with 17 (15.9%), 89 (83.2%), and one (0.9%) using dedicated limited, multi-purpose, other fields of view, respectively. SPECT units generally use one of two types of software to generate images: filtered projection in 43 (43.9%) units or interactive reconstruction in 55 (56.1%) units.
Projections of the Numbers of SPECT Units and Exams
To help provide insight on potential growth in demand for imaging equipment, we used the results of the 2020 survey and previous iterations to project potential demand for units and exams up to the year 2040, based on population growth. As some jurisdictions reported combined counts of SPECT and SPECT-CT units and exams for 2020, a combined projection was produced for exams and is reported in the section on SPECT-CT.
Single-Photon Emission Computed Tomography–Computed Tomography
Number and Location of SPECT-CT Units
One hundred and sixty sites in 10 provinces or territories have one or more SPECT-CT units (mean 1.7 per site). There were up to six units per site, for a total of 271 (12 at free-standing sites) units. Ontario, Quebec, and Alberta had the most SPECT-CT units. The number of units in provinces or territories with the modality ranged from 0 to 17.2 per million population, but this did not reflect accessibility, particularly in provinces and territories with large remote areas.
One hundred and twenty-six SPECT-CT units were installed between 2015 and 2020 (Table 9). Among the units with information, 17 were replacement units for decommissioned units, 13 were new units, and 63 others were not specified as new or replacement. No sites have reported decommissioning a SPECT-CT unit since the last survey in 2017, and 26 sites reported planned installations of one or more SPECT-CT units in the next two years (Table 54).
Table 54: Summary of Availability and Status of SPECT-CT Units by Provinces and Territories in 2020
| Province or territory | Sites with availabilitya | Total unitsb (free-standing facilities) | Sites planning to install new or replacement units c | Sites decommissioning since 2017d | Units per million populatione |
|---|---|---|---|---|---|
| Alberta | 24 | 38 (11) | 4 | 0 | 8.6 |
| British Columbia | 19 | 30 (0) | 4 | 0 | 5.9 |
| Manitoba | 4 | 8 (0) | 3 | 0 | 5.8 |
| New Brunswick | 5 | 5 (0) | 3 | 0 | 6.4 |
| Newfoundland and Labrador | 4 | 9 (0) | 0 | 0 | 17.2 |
| Nova Scotia | 8 | 10 (0) | 1 | 0 | 10.2 |
| Ontario | 50 | 85 (1) | 10 | 0 | 5.8 |
| Prince Edward Island | 1 | 2 (0) | 0 | 0 | 12.7 |
| Quebec | 40 | 76 (0) | 1 | 0 | 8.9 |
| Saskatchewan | 5 | 8 (0) | 0 | 0 | 6.8 |
| Nunavut | 0 | 0 (0) | 0 | 0 | 0.0 |
| Northwest Territories | 0 | 0 (0) | 0 | 0 | 0.0 |
| Yukon | 0 | 0 (0) | 0 | 0 | 0.0 |
| Canada | 160 | 271 (12) | 26 | 0 | 7.2 |
SPECT-CT = single-photon emission computed tomography–computed tomography.
a Data derived from number of units with technical details (make, model, first year of operation, and status as decommissioned/non-decommissioned), as provided by survey respondents to CMII and CIHI, and industry sources.
b Data obtained from provincial validators.
c Data derived from the survey question: “Do you have plans to install the following in the next two years?”
d Data derived from the survey question: “Have you decommissioned a [modality] unit since January 2, 2017?”
e The population (estimated) as of fourth quarter, 2019 (see Table 4).23
Free-Standing Institutes
Overall, there are 12 SPECT-CT units at 10 free-standing institutes across Canada. Free-standing institutes were mainly identified as privately funded and are located in two provinces: Alberta and Ontario. Most sites did not provide information on examinations per year, with only three sites reporting this data.
Geographical Distribution of SPECT-CT
Figure 15 shows the geographical distribution of SPECT-CT units across Canada, mapped to the level of settlement (city or town), with circle diameter proportional to the number of units. Counts for all sites within a city/town were aggregated.
Figure 15: Geographic Distribution of SPECT-CT Units in Canadian Cities or Towns
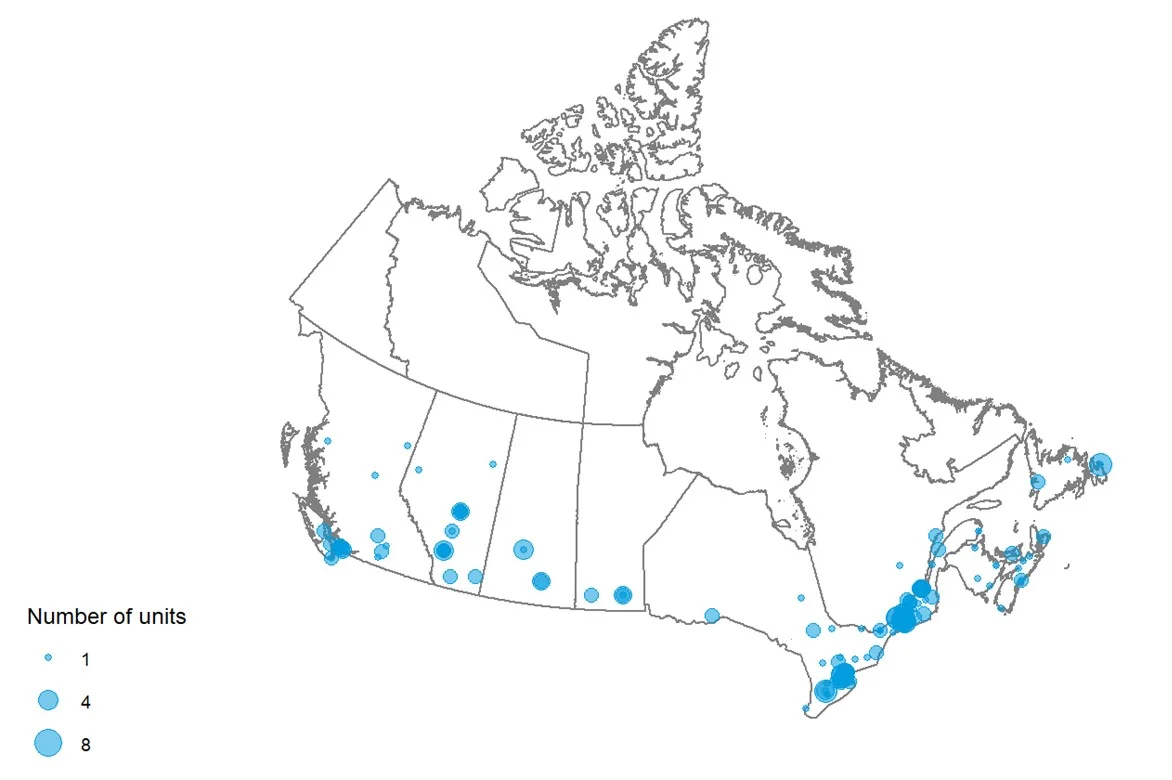
SPECT-CT = single-photon emission computed tomography–computed tomography.
Availability and unit counts by site were derived from validator data; where these were unavailable, the data were from the survey.. Mobile units appear as one unit at each of the sites served.
Mobile SPECT-CT Units
There were no mobile SPECT-CT units shared between sites.
Number of Examinations in a Fiscal Year: SPECT and SPECT-CT
This report prefers validator-provided counts for units and exams. For SPECT and SPECT-CT, several jurisdictions reported only combined exams. Therefore, combined SPECT and SPECT-CT exams are summarized in this section. The mean number of exams per unit was 607.6. Table 55 shows the recorded total number of exams by province and the number of exams per thousand people.
Table 55: Total Examinations per Fiscal Year for SPECT and SPECT-CT Units in 2020
| Province or territory | Units with dataa (free-standing sites) | All unitsa | Total examsb | Exams per unit | Populationc | Exams per thousand population |
|---|---|---|---|---|---|---|
| Alberta | 75 (38) | 75 | 47,858 d | 1,268.9 | 4,395,586 | 10.9 |
| British Columbia | 54 (0) | 54 | 66,604 | 2,509.5 | 5,105,576 | 13.0 |
| Manitoba | 14 (0) | 14 | 29,400 | 4,125.0 | 1,373,859 | 21.4 |
| New Brunswick | 16 (0) | 16 | 16,219 d | 2,925.4 | 780,021 | 20.8 |
| Newfoundland and Labrador | 12 (0) | 12 | 33,095 d | 4,555.9 | 521,922 | 63.4 |
| Northwest Territories | 0 (0) | 0 | 0 | 0.0 | 44,895 | 0.0 |
| Nova Scotia | 17 (0) | 17 | 30,235 | 3,650.7 | 976,768 | 31.0 |
| Nunavut | 0 (0) | 0 | 0 | 0.0 | 38,873 | 0.0 |
| Ontario | 220 (15) | 220 | 200,833 | 1,487.7 | 14,659,616 | 13.7 |
| Prince Edward Island | 2 (0) | 2 | 2,129 d | 1,064.5 | 157,901 | 13.5 |
| Quebec | 151 (0) | 151 | 783,667 d | 10,448.9 | 8,522,800 | 91.9 |
| Saskatchewan | 15 (0) | 15 | 33,723 d | 4,470.8 | 1,178,657 | 28.6 |
| Yukon | 0 (0) | 0 | 0 | 0.0 | 41,022 | 0.0 |
| Canada | 576 (53) | 576 | 1,243,763 | 4,145.6 | 37,797,496 | 32.9 |
SPECT-CT = single-photon emission computed tomography–computed tomography.
a Data derived from number of units with technical details (make, model, first year of operation, and status as decommissioned/non-decommissioned).
b Data derived from the question: “For all [modality] units, how many examinations on average were conducted in the last fiscal year?”
c The population (estimated) as of fourth quarter, 2019.23
d Fiscal year 2018-2019.
Age of SPECT-CT Units by CMII Survey Years
There are 161 out of 271 (59.4%) imaging units with information on the first years of operation. Table 56 shows the first years of operation by the CMII survey year (2015, 2017, and 2020) and jurisdiction. There were 56 SPECT-CT units installed after the last CMII survey in 2017.
Table 56: First Years of Operation of the SPECT-CT Units by Province and Territory
| Province or territory | 2015 years and earlier | 2016 to 2017 years | 2018 to 2020 years | 2021 years and later | Total |
|---|---|---|---|---|---|
| Number (%) of currently operating units by first year of operation | |||||
| Alberta | 22 (95.7) | 1 (4.3) | 0 (0) | 0 (0) | 23 (100) |
| British Columbia | 12 (57.1) | 3 (14.3) | 6 (28.6) | 0 (0) | 21 (100) |
| Manitoba | 7 (100) | 0 (0) | 0 (0) | 0 (0) | 7 (100) |
| New Brunswick | 2 (66.7) | 0 (0) | 1 (33.3) | 0 (0) | 3 (100) |
| Newfoundland and Labrador | 4 (50) | 0 (0) | 4 (50) | 0 (0) | 8 (100) |
| Northwest Territories | NR | NR | NR | NR | NR |
| Nova Scotia | 7 (87.5) | 1 (12.5) | 0 (0) | 0 (0) | 8 (100) |
| Nunavut | NR | NR | NR | NR | NR |
| Ontario | 20 (87) | 2 (8.7) | 1 (4.3) | 0 (0) | 23 (100) |
| Prince Edward Island | NR | NR | NR | NR | NR |
| Quebec | 13 (21.7) | 3 (5) | 44 (73.3) | 0 (0) | 60 (100) |
| Saskatchewan | 7 (87.5) | 1 (12.5) | 0 (0) | 0 (0) | 8 (100) |
| Yukon | NR | NR | NR | NR | NR |
| Canada | 94 (58.4) | 11 (6.8) | 56 (34.8) | 0 (0) | 161 (100) |
NR = not reported; SPECT-CT = single-photon emission computed tomography–computed tomography.
Note: Data derived from the survey question: “What year did (or will) the [modality] unit become operational?”
Full-Time Equivalent Medical Radiation Technologists for SPECT and SPECT-CT Units
Survey participants were asked to provide information on the number of FTE MRTs assigned to all SPECT and SPECT-CT units at the site level. An FTE position for an MRT is considered to amount to an eight-hour day, five days per week. Eighty-seven sites of 138 (63%) sites reported information. There are one to 24 FTE MRTs assigned per site. The numbers of FTE MRTs per site by provinces and territories are shown in Table 57.
Table 57: Numbers of Full-time Equivalent Medical Radiation Technologists per Site for SPECT and SPECT-CT Units by Province and Territory
| Province or territory | All sites with information | Total FTE MRTs | FTE MRTs per million population | Average per site | Minimal numbers per site | Maximal numbers per site |
|---|---|---|---|---|---|---|
| Alberta | 20 | 146 | 33.2 | 7.3 | 1 | 18 |
| British Columbia | 19 | 108 | 21.2 | 5.7 | 1 | 16 |
| Manitoba | 4 | 31 | 22.6 | 7.8 | 3 | 12 |
| New Brunswick | 4 | 16 | 20.5 | 4.0 | 2 | 6 |
| Newfoundland and Labrador | 4 | 17 | 32.6 | 4.2 | 2 | 6 |
| Northwest Territories | NA | NA | NA | NA | NA | NA |
| Nova Scotia | 7 | 29 | 29.7 | 4.1 | 2 | 13 |
| Nunavut | NA | NA | NA | NA | NA | NA |
| Ontario | 17 | 95 | 6.5 | 5.6 | 1 | 24 |
| Prince Edward Island | 1 | 3 | 19.0 | 3 | 3 | 3 |
| Quebec | 6 | 53 | 6.2 | 8.8 | 2 | 18 |
| Saskatchewan | 5 | 48 | 40.7 | 9.6 | 3 | 18 |
| Yukon | NA | NA | NA | NA | NA | NA |
| Canada | 87 | 546 | 14.4 | 6.3 | 1 | 24 |
FTE = full-time equivalent; MRT = medical radiation technologist; NA = not applicable; SPECT = single-photon emission computed tomography; SPECT-CT = single-photon emission computed tomography–computed tomography.
a Data derived from the survey question: “How many FTE technologists are assigned to all [modality] units (collective number of FTEs for all units)?”
b The population (estimated) as of fourth quarter, 2019.23
Typical Hours of Operation and All-Day and Weekend Use
Hours Per Day and 24-Hour Use for SPECT-CT Units
One hundred and two out of 160 publicly funded sites provided data for the average number of hours per day that SPECT-CT units were in use. Across all provinces where a modality was available, SPECT-CT units were used for an average of 7.1 hours to 10.7 hours per day (Table 87). Fifty (49%) units were used for less than eight hours per day, 43 (42.2%) were used for eight to less than 12 hours per day, nine (8.8%) of units were used for 12 to less than 18 hours a day, and no units were used for more than 18 hours per day. Two (2%) sites reported that at least one unit was used for 24 hours a day (Table 88).
Hours Per Week and Weekend Use for SPECT-CT Units
One hundred and two out of 160 publicly funded sites provided data for the average number of hours per week that SPECT-CT units were in use. Across all provinces where a modality was available, SPECT-CT units were used for an average of 35 hours to 62.3 hours per week. Fifty (49%) units were used for less than 20 hours per week, 42 (41.2%) were used for 40 to less than 60 hours per week, 7 (6.9%) were used for 60 to less than 80 hours per week, 3 (3%) units were used for 80 to less than 120 hours a week, and no units were used for more than 120 hours per week (Table 89). Sixteen (15.7%) sites reported that at least one unit was used on weekends (Table 90).
Planned and Unplanned Downtime for SPECT-CT Units
Among 117 sites with SPECT-CT units, 60 sites reported the planned and unplanned downtime in a year. The mean planned downtime was 44.8 hours, ranging from 10 to 288 hours per year. The mean unplanned downtime was 42.1 hours, ranging from 0 to 140 hours per year. At 19 sites, the planned downtime was less than unplanned downtime. Some commonly reported reasons for discrepancies between planned and unplanned downtime include catastrophic failure, scanner breakdown, older equipment breakdown, preventive maintenance, and sourcing and delivery of replacement parts. The distributions of planned and unplanned downtime for SPECT-CT units by jurisdiction are shown in Table 58 (Table 91 and Table 92).
Table 58: Planned and Unplanned Downtime at Sites With SPECT-CT Units by Province and Territory
| Province or territory | Annual downtime – planned (hours) | Annual downtime – unplanned (hours) |
|---|---|---|
| Mean hours per year, (n, range) | ||
| Alberta | 53.4 (20, 16 to 128) |
34.6 (20, 10 to 120) |
| British Columbia | 25.6 (10, 16 to 48) |
33.3 (8, 0.4 to 100) |
| Manitoba | 43 (2, 30 to 56) |
42 (2, 24 to 60) |
| New Brunswick | 43.2 (4, 10 to 75) |
22.9 (4, 10 to 40) |
| Newfoundland and Labrador | 25 (3, 21 to 30) |
54.2 (3, 0 to 140) |
| Northwest Territories | NA | NA |
| Nova Scotia | 38.8 (6, 15 to 82) |
41.4 (6, 15 to 80) |
| Nunavut | NA | NA |
| Ontario | 38.3 (7, 22 to 54) |
54.6 (7, 8 to 120) |
| Prince Edward Island | 44 (1, 44 to 44) |
64 (1, 64 to 64) |
| Quebec | 117 (3, 21 to 288) |
74.5 (2, 49 to 100) |
| Saskatchewan | 34 (4, 24 to 48) |
72 (3, 6 to 130) |
| Yukon | NA | NA |
| Canada | 44.8 (60, 10 to 288) |
42.1 (56, 0 to 140) |
NA = not available; SPECT-CT = single-photon emission computed tomography–computed tomography.
Note: Data derived from the survey question: “How much planned downtime is anticipated for scheduled maintenance for all units in a given year? (expressed in hours)” and “How much unplanned downtime is experienced for all units in a given year? (expressed in hours).”
Types of SPECT-CT Use
Survey participants were asked to provide the overall percentage of use for cardiac exams, noncardiac exams, research, and any other type of use. Use breakdown was available 63 sites with SPECT-CT units. On average, the highest mean percentage of use for SPECT-CT was noncardiac, at 76% (range 12% to 100%), followed by cardiac use, at 23.2% (range 0% to 88%), and research use, at 0.5% (range 0% to 10%). Details are available in Table 93.
Survey participants reported the overall percentage of use for SPECT-CT for diagnostic, interventional, and research purposes, as well as other type of use. Use breakdown was available for 59 sites with SPECT-CT units. On average, the highest mean percentage of use for SPECT-CT was diagnostic, at 98.8% (range 80% to 100%), followed by interventional use, at 0.2% (range 0% to 5%), and research use, at 0.7% (range 0% to 10%).
Data on the overall percentage of use by discipline for all SPECT-CT units were collected from survey participants. The categories included oncology, respiratory, hepatobiliary, musculoskeletal, inflammatory or infectious disease, neurological, cardiac, trauma, and other. Usage breakdown was available for 40 SPECT-CT sites. On average, the highest mean percentage of use for SPECT-CT of all available sites was for cardiac exams, at 33.3% (use at individual sites ranged from 0% to 100%), followed by musculoskeletal exams, at 23.1% (range 0% to 100%), oncology, at 22.4% (range 0% to 100%), and respiratory exams, at 5.95% (range 0% to 26%). Details are available in Table 94. Due to the low response rate, data may not be representative of all sites.
Clinical Decision Support Tools for SPECT-CT Units
Survey participants were asked to provide information on the adoption of CDST at the point of care by referring physicians ordering SPECT-CT exams. A CDST was described as a tool that provides real-time guidance to physicians on the appropriateness of diagnostic imaging tests for a given patient during the ordering process. Among the 60 sites with SPECT-CT units and information on the use of CDSTs, two (3.3%) reported that referring physicians used CDSTs for ordering SPECT-CT exams. The use of CDSTs by province is summarized in Table 59.
Table 59: Use of Clinical Decision Support Tools at Sites With SPECT-CT Units by Province and Territory
| Province or territory | CDST used | CDST not used |
|---|---|---|
| Number of sites (%) | ||
| Alberta | 0 (0) | 19 (100) |
| British Columbia | 1 (9.1) | 10 (90.9) |
| Manitoba | 0 (0) | 2 (100) |
| New Brunswick | 0 (0) | 3 (100) |
| Newfoundland and Labrador | 0 (0) | 3 (100) |
| Northwest Territories | NA | NA |
| Nova Scotia | 0 (0) | 5 (100) |
| Nunavut | NA | NA |
| Ontario | 1 (10) | 9 (90) |
| Prince Edward Island | NR | NR |
| Quebec | 0 (0) | 3 (100) |
| Saskatchewan | 0 (0) | 4 (100) |
| Yukon | NA | NA |
| Canada | 2 (3.4) | 58 (96.6) |
CDST = clinical decision support tool; NA = not applicable; NR = not reported; SPECT-CT = single-photon emission computed tomography–computed tomography.
Note: Data derived from survey question: “Is a clinical decision support tool used at the point of care by medical professionals referring patients to medical imaging? A clinical decision support tool provides real-time guidance to physicians on the appropriateness of diagnostic imaging tests for a given patient during the ordering process.”
Use of Peer Review for SPECT-CT Images
Survey participants were asked to provide information on the use of peer review as a quality assurance tool for reading and interpreting images. Of the 62 sites that responded to the question as to whether SPECT-CT images were peer-reviewed, 23 (37.1%) responded “yes.” Ontario and British Columbia had the highest rates of peer review. The use of peer review by province is summarized in Table 60.
Table 60: Use of Peer Review for SPECT-CT Images, Summarized by Province/Territory
| Province or territory | Conduct peer review | Do not conduct peer review | Total |
|---|---|---|---|
| Number of sites (%) | |||
| Alberta | 5 (25.0) | 15 (75.0) | 20 (100) |
| British Columbia | 7 (53.8) | 6 (46.2) | 13 (100) |
| Manitoba | 0 | 3 (100) | 3 (100) |
| New Brunswick | 1 (25.0) | 3 (75.0) | 4 (100) |
| Newfoundland and Labrador | 0 | 3 (100) | 3 (100) |
| Northwest Territories | NA | NA | NA |
| Nova Scotia | 2 (50.0) | 2 (50.0) | 4 (100) |
| Nunavut | NA | NA | NA |
| Ontario | 7 (63.6) | 4 (36.4) | 11 (100) |
| Prince Edward Island | NR | NR | NR |
| Quebec | 1 (33.3) | 2 (66.7) | 3 (100) |
| Saskatchewan | 0 | 1 (100) | 1 (100) |
| Yukon | NA | NA | NA |
| Canada | 23 (37.1) | 39 (62.9) | 62 (100) |
NA = not applicable; NR = not reported; SPECT-CT = single-photon emission computed tomography–computed tomography.
Note: Derived from the survey question: “Do radiologists at your facility participate in a peer review program for image reading and interpretation for the purpose of quality assurance?”
Integration of Artificial Intelligence in SPECT-CT Imaging
Survey participants were asked to report on the use of AI in the clinical and/or research setting for the following purposes: lowering radiation dose, reading and interpreting images, reconstructing images, planning treatment, predicting outcomes, and carrying out administrative tasks. Results for SPECT are shown in Table 61.
Table 61: Summary of Use of AI in SPECT-CT
| Number of sites / number of responses | Number of sites – yes (%) | Setting: clinical / research / both | Provinces (number of sites) |
|
|---|---|---|---|---|
| Is AI used in lowering radiation dose | 109 / 71 | 6 (5.5) | 6 / 0 / 0 | BC (1), MB (1), ON (1), QC (1), SK (2) |
| Is AI used in reading and interpreting images | 109 / 70 | 1 (0.9) | 0 / 1 / 0 | BC (1) |
| Is AI used in image reconstruction | 109 / 71 | 11 (10.1) | 10 / 0 / 0 NR 1 |
BC (4), MB (1), NL (1), NS (1), ON (1), SK (3) |
| Is AI used in treatment planning | 109 / 71 | 0 | 0 | - |
| Is AI used in predicting outcomes | 109 / 71 | 0 | 0 | - |
| Is AI used for administrative tasks | 109 / 69 | 2 (1.8) | 0 / 0 / 1 NR 1 |
BC (1), NS (1) |
AI = artificial intelligence; BC = British Columbia; MB = Manitoba; NL = Newfoundland and Labrador; NR = not reported; NS = Nova Scotia; ON = Ontario;
SK = Saskatchewan; SPECT-CT = single-photon emission computed tomography–computed tomography.
Note: From survey questions: “Is artificial intelligence used to support: The reading/interpretation of images? Predicting outcomes? Lower radiation dose? Image resolution/reconstruction enhancement? Treatment planning? Administrative tasks?”
Six sites (5.5%) in five provinces reported using AI in lowering radiation dose in SPECT-CT imaging, all in the clinical setting.
One site (0.9%) reported using AI for reading and interpreting SPECT-CT images, in the research setting.
Eleven sites (10.1%) in six provinces reported using AI for image reconstruction, 10 in the clinical setting and one unreported.
Two sites (1.8%), one in British Columbia and one in Nova Scotia, reported using AI for SPECT-CT administrative tasks, one for both clinical and research, and one in an unreported setting.
Exam-Ordering Practices at Sites with SPECT-CT Units
Survey participants were asked to report their use of various exam-ordering practices from the following options: requests by automated order entry, paper, fax, telephone, and centralized order entry for some, or all, exams. Among the 75 sites that provided a response to this question, the most common exam-ordering practice across Canada for SPECT-CT is paper and fax, at 100% of sites, followed by both automated order entry and centralized booking for some exams, at 54.7% of sites in provinces with SPECT-CT. The use of exam-ordering practices is summarized by province in Table 60 (Table 95 and Table 96).
Table 62: Exam-Ordering Practice at Sites with SPECT-CT Units by Province and Territory
| Province or territory | Automated entry forms | Paper forms | Requests – fax | Requests – telephone | Centralized booking – all exams | Centralized booking – some exams | ||||||
|---|---|---|---|---|---|---|---|---|---|---|---|---|
| Number (%) of sites that use these exam-ordering practices | ||||||||||||
| Yes | No | Yes | No | Yes | No | Yes | No | Yes | No | Yes | No | |
| Alberta | 14 (70) | 6 (30) | 20 (100) | 0 (0) | 20 (100) | 0 (0) | 7 (35) | 13 (65) | 6 (30) | 14 (70) | 14 (73.7) | 5 (26.3) |
| British Columbia | 10 (62.5) | 6 (37.5) | 16 (100) | 0 (0) | 16 (100) | 0 (0) | 4 (25) | 12 (75) | 5 (31.2) | 11 (68.8) | 5 (33.3) | 10 (66.7) |
| Manitoba | 1 (33.3) | 2 (66.7) | 3 (100) | 0 (0) | 3 (100) | 0 (0) | 1 (33.3) | 2 (66.7) | 0 (0) | 3 (100) | 0 (0) | 3 (100) |
| New Brunswick | 2 (50) | 2 (50) | 4 (100) | 0 (0) | 4 (100) | 0 (0) | 2 (50) | 2 (50) | 3 (75) | 1 (25) | 4 (100) | 0 (0) |
| Newfoundland and Labrador | 1 (33.3) | 2 (66.7) | 3 (100) | 0 (0) | 3 (100) | 0 (0) | 1 (33.3) | 2 (66.7) | 2 (66.7) | 1 (33.3) | 2 (66.7) | 1 (33.3) |
| Northwest Territories | NA | NA | NA | NA | NA | NA | NA | NA | NA | NA | NA | NA |
| Nova Scotia | 2 (33.3) | 4 (66.7) | 6 (100) | 0 (0) | 6 (100) | 0 (0) | 3 (50) | 3 (50) | 2 (33.3) | 4 (66.7) | 0 (0) | 4 (100) |
| Nunavut | NA | NA | NA | NA | NA | NA | NA | NA | NA | NA | NA | NA |
| Ontario | 7 (50) | 7 (50) | 14 (100) | 0 (0) | 14 (100) | 0 (0) | 6 (42.9) | 8 (57.1) | 7 (50) | 7 (50) | 7 (58.3) | 5 (41.7) |
| Prince Edward Island | 1 (5) | 0 (0) | 1 (60) | 0 (40) | 1 (100) | 0 (0) | 0 (0) | 2 (100) | 1 (100) | 0 (0) | 0 (0) | 0 (0) |
| Quebec | 1 (25) | 3 (75) | 4 (100) | 0 (0) | 4 (35) | 0 (0) | 0 (0) | 4 (100) | 4 (100) | 0 (0) | 1 (50) | 1 (50) |
| Saskatchewan | 2 (50) | 2 (50) | 4 (100) | 0 (0) | 4 (100) | 0 (0) | 2 (50) | 2 (50) | 2 (66.7) | 1 (33.3) | 2 (100) | 0 (0) |
| Yukon | NA | NA | NA | NA | NA | NA | NA | NA | NA | NA | NA | NA |
| Canada | 41 (54.7) | 33 (45.3) | 75 (100) | 0 (0) | 75 (100) |
0 (0) | 26 (34.7) | 49 (65.3) | 30 (40.5) | 44 (59.5) | 35 (54.7) | 29 (45.3) |
NA = not applicable; SPECT-CT = single-photon emission computed tomography–computed tomography.
Note: Data derived from survey question: “Are automated order entry forms (exams request) used?”; “Are paper forms (exams requests) used?”; “Are requests received by fax?”; “Are requests received by phone?”; and “Is a centralized order entry (booking) system used? For all exams: Yes/no; For some exams: yes/no.”
Exam-Ordering Privileges at Sites with SPECT-CT Units
Jurisdictional validators were asked to provide details on the exam-ordering privileges of various types of health care professionals working in the public setting. Responses are summarized in Table 63. Clinical specialists in all provinces and territories are authorized to order SPECT and SPECT-CT exams, although some provinces restrict ordering privileges to specific types of specialists. Family physicians, general practitioners, and nurse practitioners have the same SPECT and SPECT-CT exams ordering privileges within each jurisdiction. In Manitoba, neither family physicians, general practitioners, or nurse practitioners can order myocardial perfusion imaging exams.
In British Columbia, some health care professionals, such as chiropractors, dentists, and podiatric surgeons, can order SPECT and SPECT-CT exams, although these exams may not always be covered under the public medical services plan. In Alberta, other allied health professionals may qualify to request SPECT and SPECT-CT exams, depending on licensing and credentialing requirements.
No data were available for Quebec or Ontario. As well, for New Brunswick, the responses came from one of the two regional health authorities, the Horizon Health Network.
Table 63: Types of Health Care Professionals With SPECT and SPECT-CT Exam-Ordering Privileges
| Province or territory | Clinical specialists | Family physicians/ general practitioners |
Nurse practitioners |
|---|---|---|---|
| Alberta | Yes | Yes | Yes |
| Depending on licensing and credentialing, other allied health professionals may have qualifications to request | |||
| British Columbia | Yes | Yes | Yes |
| Other: chiropractor, dentists, podiatric surgeon | |||
| Manitoba | Yes | Yes | Yes |
| Yes, if under guidance of a family physician/ general practitioner: yes (but no MPIs) Nurse practitioner: yes (but no MPIs) Other, please specify Health care learners (e.g., medical students, residents, and physician assistants) can order these tests under the supervision of someone who has authorization |
|||
| New Brunswicka | Yes | Yes | Yes |
| Newfoundland and Labrador | Yes | Yes | Yes |
| Northwest Territories | Yes | No | No |
| Nova Scotia | Yes | Yes | Yes |
| Nunavut | NA | NA | NA |
| Ontario | NR | NR | NR |
| Prince Edward Island | Yes | Yes | Yes |
| Health care learners (e.g., medical students, residents, and physician assistants) can order these tests under the supervision of someone with authorization | |||
| Quebec | NR | NR | NR |
| Saskatchewan | Yes | Yes | Yes |
| Yukon | NA | NA | NA |
MPI = myocardial perfusion imaging; NA = not applicable; NR = no response; SPECT-CT = single-photon emission computed tomography–computed tomography.
a Horizon Health.
Note: Data from the question: “Which health care professionals can order imaging exams for SPECT and SPECT-CT?”
Imaging Equipment Servicing Methods at Sites with SPECT-CT Units
Survey participants were asked to report on methods for servicing imaging equipment. The servicing methods included à la carte, full vendor, insurance, shared service, third-party, under warranty, and others. Among the 160 sites with one or more SPECT-CT units, 73 provided information on servicing methods. For all reporting sites, the most commonly used equipment servicing method for SPECT-CT was full vendor support, with 38 (52%) sites reporting using this method, followed by third-party support, at 21 (28.8%) sites. It should be noted that survey participants were asked to report this data at the modality level rather than the unit level. We received feedback from survey participants indicating that, at sites where there was more than one unit, different servicing agreements may be used for different units. Our survey did not accommodate for the different plans between unit types. The proportions of servicing methods by province and territory are shown in Table 64 (Table 97 and Table 98).
Table 64: Imaging Equipment Servicing Methods at Sites With SPECT-CT Units by Province and Territory
| Province or territory | À la carte | Full vendor | Insurance | Shared service | Third-party | Under warranty | Other |
|---|---|---|---|---|---|---|---|
| Number of sites (%) | |||||||
| Alberta | 0 (0) | 13 (65) | 0 (0) | 0 (0) | 5 (25) | 0 (0) | 2 (10) |
| British Columbia | 1 (6.2) | 3 (18.8) | 0 (0) | 2 (12.5) | 9 (56.2) | 0 (0) | 1 (6.2) |
| Manitoba | 0 (0) | 1 (33.3) | 0 (0) | 2 (66.7) | 0 (0) | 0 (0) | 0 (0) |
| New Brunswick | 0 (0) | 3 (75) | 0 (0) | 0 (0) | 1 (25) | 0 (0) | 0 (0) |
| Newfoundland and Labrador | 0 (0) | 2 (66.7) | 0 (0) | 0 (0) | 0 (0) | 0 (0) | 1 (33.3) |
| Northwest Territories | NA | NA | NA | NA | NA | NA | NA |
| Nova Scotia | 0 (0) | 8 (100) | 0 (0) | 0 (0) | 0 (0) | 0 (0) | 0 (0) |
| Nunavut | NA | NA | NA | NA | NA | NA | NA |
| Ontario | 0 (0) | 6 (54.5) | 0 (0) | 1 (9.1) | 2 (18.2) | 2 (18.2) | 0 (0) |
| Prince Edward Island | 1 (50) | 0 (0) | 0 (0) | 0 (0) | 1 (50) | 0 (0) | 0 (0) |
| Quebec | 0 (0) | 0 (0) | 0 (0) | 0 (0) | 2 (100) | 0 (0) | 0 (0) |
| Saskatchewan | 0 (0) | 2 (50) | 0 (0) | 0 (0) | 2 (50) | 0 (0) | 0 (0) |
| Yukon | NA | NA | NA | NA | NA | NA | NA |
| Canada | 2 (2.7) | 38 (52) | 0 (0) | 6 (15.8) | 21 (28.8) | 2 (2.7) | 4 (5.5) |
NA = not applicable; SPECT-CT = single-photon emission computed tomography–computed tomography.
Note: Data derived from the survey question: “How is imaging equipment serviced?”
Technical Characteristics of SPECT-CT Units
The number of CT multi-detectors (slices) was reported for 165 units, and the number of detector heads for 154 units. The number of slices ranged from one to 32, with the most common being four in 45 (27.3%) units, 16 in 44 (26.7%) units, one in 23 (13.9%) units, two in 18 (10.9%) units, six in 17 (10.3%) units, eight in 10 (6.1%) units, 32 in 4 (2.4%) units, and unknown in four (2.4%) units. Most machines, 150 (97.4%), were equipped with two detector heads. Information on the field of view was reported for 137 SPECT-CT units. The most common field of view was multi-purpose, with 131 (95.6%) units equipped with this functionality.
One hundred and thirty-one units included responses for software for image processing. One hundred (76.3%) of the SPECT-CT units used interactive reconstruction software for image processing, with the remaining using filtered projection in 30 (22.9%) units, and reconstruction interactive software in 1 (0.8%) unit. Out of 149 units that provided information on whether they were dedicated to cardiac imaging or used for multi-purpose or noncardiac imaging, 12 (8.1%) were dedicated cardiac units, with the remaining 137 (91.9%) used for multi-purpose or noncardiac imaging.
Finally, 142 units included information on whether the CT component of SPECT-CT units was operated as a stand-alone CT. Of these, 19 (13.4%) SPECT-CTs operated as stand-alone CT units, which allowed for extra CT capacity in some facilities.
Radiation Considerations for SPECT-CT
The survey also asked about features intended to manage radiation safety. Information on whether dose-management controls were used was available for 128 units, of which 86 (67.2%) use these controls. Data for the others were missing (Table 86). Information was available for 115 units on whether they incorporated reconstruction techniques for dose reduction, and 83 (72.2%) reported that they did. Information was available for 125 units on whether units recorded patient radiation dose per exam, and 92 (73.6%) reported that they did. Two (2%) out of 99 sites reported using cumulative radiation dose tracking, and 43 (79%) sites out of 54 reported plans to do this in the future.
Projections of the Numbers of SPECT and SPECT-CT Units and Exams
To provide insight on the level of investment that may be required to meet ongoing demand for SPECT and SPECT-CT, this iteration of the CMII forecasts the potential demand for SPECT and SPECT-CT units and the volume of exams for the following years: 2025, 2030, 2035, and 2040.
The projections for number of units are shown in Figure 16 (see Table 99 for population projections and Table 106 for the projections of unit numbers). Three different population scenarios are envisioned, for low, median, and high projected growth. Across all of Canada, the number of SPECT and SPECT-CT units is projected to be 688.7 (range 635.9 to 750.1) in 2040. In the provinces and territories with SPECT and SPECT-CT, the number of units is projected to increase or stay the same for either median or high population growth, with the exception of Newfoundland and Labrador, which has a projected population decline in those scenarios. The number of units in Ontario, for example, is projected to increase from 220 to 266 units and in Quebec, from 151 to 165 units. The number of units in Newfoundland and Labrador is projected to decline from 12 to 11 units. As none of the territories have SPECT and SPECT-CT units, it is impossible to project growth. When low population growth is assumed, the number of SPECT and SPECT-CT units are projected to increase in Prince Edward Island, Quebec, Ontario, Manitoba, Saskatchewan, Alberta, and Yukon, but not in Nova Scotia, Newfoundland and Labrador, and New Brunswick, all of which have a projected population decline.
Figure 16: Projection of SPECT and SPECT-CT Units for 2025, 2030, 2035, and 2040
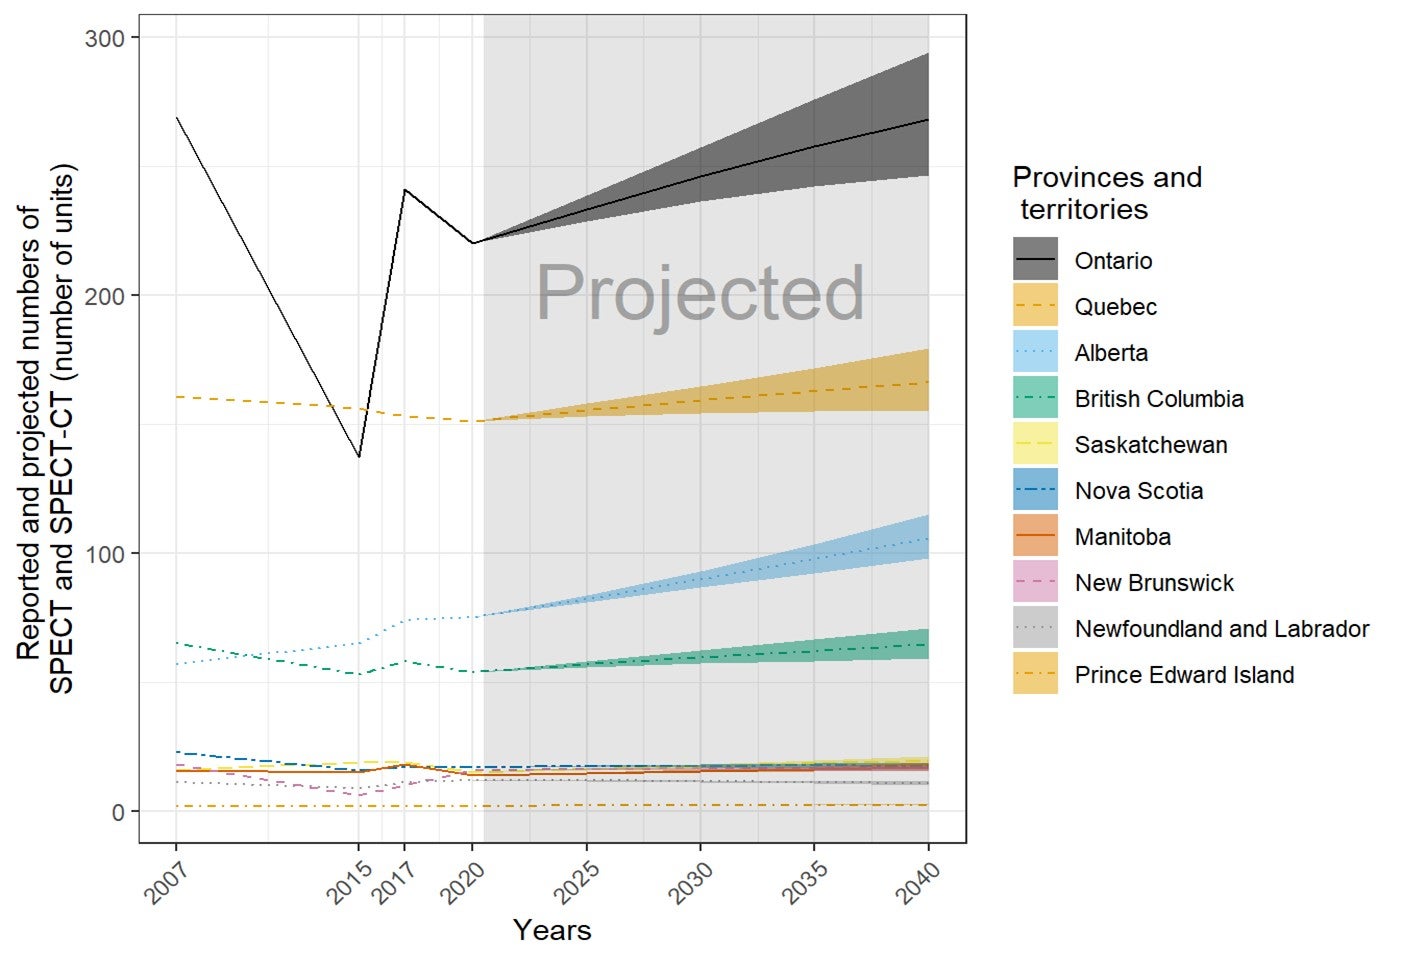
SPECT = single-photon emission computed tomography; SPECT-CT = single-photon emission computed tomography–computed tomography.
The order of the provinces and territories is based on the number of SPECT and SPECT-CT (number of exams × 1,000) in 2040. The projection was calculated from the products of the numbers of per capita units or exams in 2020 and the population projections in 2025, 2030, 2035, and 2040. The numbers of imaging units or exams were provided by provincial or territorial validators in 2020. The population projections were retrieved from Statistics Canada website on January 6, 2020.23 The solid lines of projections were based on the population projection, assuming median growth. The upper and lower bounds were based on population projections, assuming high and low growth, respectively.
The projections for number of examinations are shown in Figure 17 (see Table 107 for details). Across all of Canada, the number of SPECT and SPECT-CT exams is projected to increase to 1,414,877 (range 1,312,195 to 1,532,924) in 2040. In all provinces and territories, the number of SPECT and SPECT-CT exams is projected to increase or stay the same for either median or high population growth, with the exception of Newfoundland and Labrador, which has a projected population decline. Ontario, for example, is projected to show an increase in exams from 200,833 (rounded) to 245,115.8, and Quebec, from 783,667 to 860,012.7, both based on median estimated population growth. Newfoundland and Labrador is projected to decline from 30,235 to 28,846 exams. When low population growth was assumed, the number of CT units are projected to increase in Prince Edward Island, Quebec, Ontario, Manitoba, Saskatchewan, Alberta, and British Columbia, but not in Nova Scotia, Newfoundland and Labrador, and New Brunswick, all of which have a projected population decline.
Figure 17: Projection of SPECT and SPECT-CT Examinations (Thousands) for 2025, 2030, 2035, and 2040
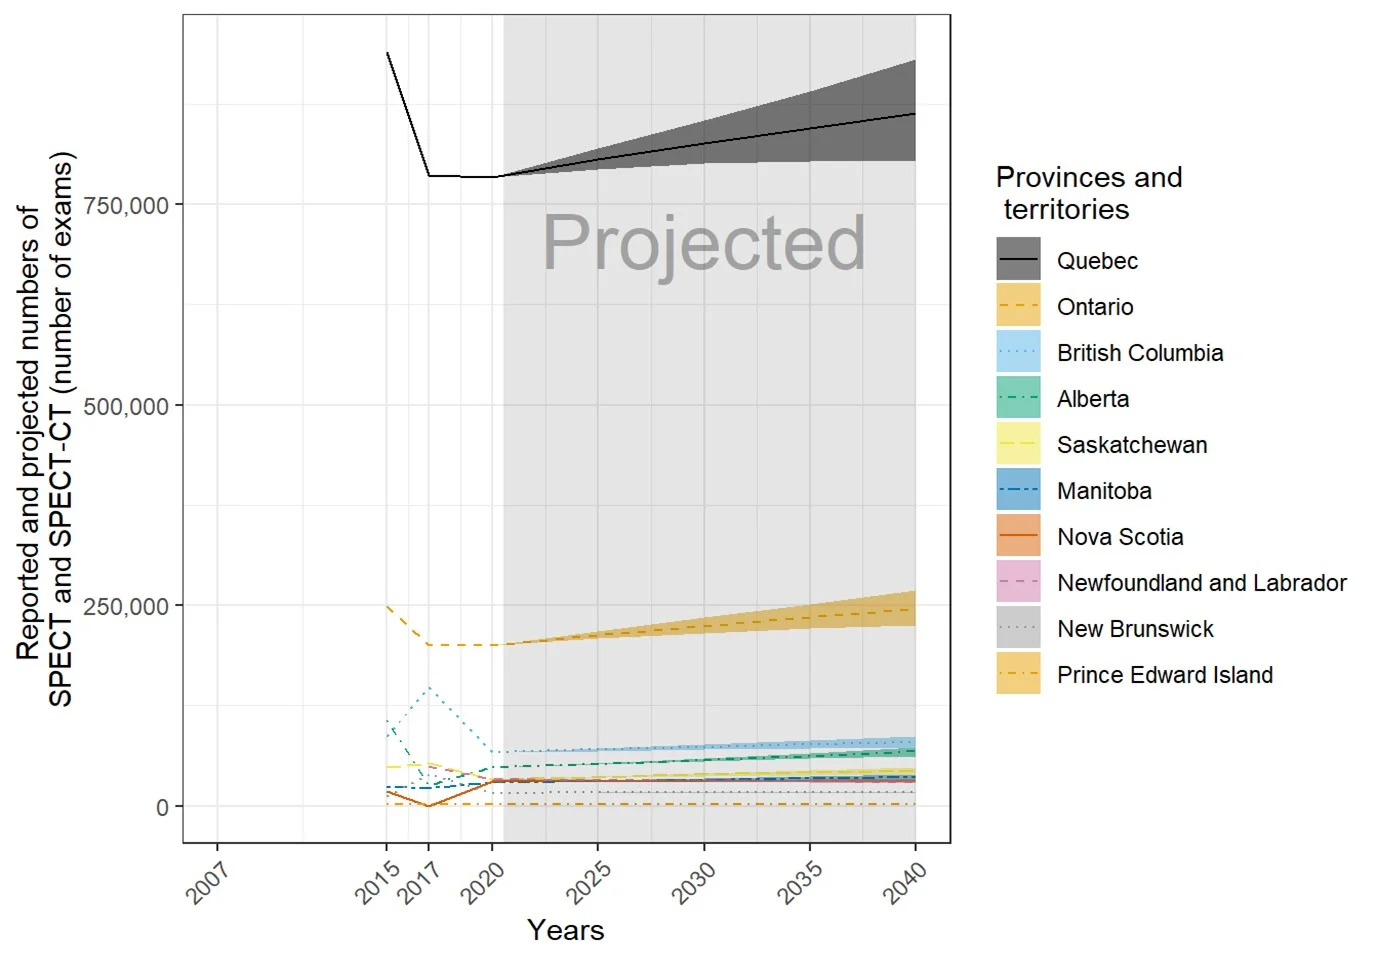
SPECT = single-photon emission computed tomography; SPECT-CT = single-photon emission computed tomography–computed tomography.
The order of the provinces and territories is based on the number of SPECT and SPECT-CT (number of exams × 1,000) in 2040. The projection was calculated from the products of the numbers of per capita units or exams in 2020 and the population projections in 2025, 2030, 2035, and 2040. The numbers of imaging units or exams were provided by provincial or territorial validators in 2020. The population projections were retrieved from Statistics Canada website on January 6, 2020.23 The solid lines of projections were based on the population projection, assuming median growth. The upper and lower bounds were based on population projections, assuming high and low growth, respectively.
Picture Archiving and Communication Systems
Of the 318 sites in 12 provinces or territories that reported information on access to PACS, 96 (30.5%) had local access to PACS, 123 (39%) had provincial access to PACS, and 97 (30.5%) had regional access to PACS (Table 65). PACS images were accessible to referring physicians outside the imaging department at 307 (97.1%) of the 315 sites with information and were accessible throughout the provincial health care system without manual retrieval at 244 (77.5%) of 300 sites with information (Table 66).
PACS images were widely accessible to referring physicians outside the imaging department, with access available at all sites with provincial/territorial or regional access and at 90.2% (83 out of 92) of sites with local/institutional access. Access to PACS images throughout a provincial health care network, without the need to manually push images from any location or modality, was provided by 98.3% (118 out of 120) of sites with provincial/territorial access, 68.9% (63 out of 91) of sites with regional access, and 71.9% (64 out of 89) of sites with local (institutional) access. Some sites that lack a particular modality have access to images from that modality taken elsewhere. Table 66 shows the relationship between modality availability and PACS status for all sites and modalities with data available.
Table 65: Availability of Modalities and Images on PACS (Percentage of Sites) in 2020
| Modality and PACS status | CT | MRI | PET-CT | PET-MRI | SPECT | SPECT-CT |
|---|---|---|---|---|---|---|
| Number of sites (%) | ||||||
| Site has modality and does not use PACS | 34 (10.7) | 123 (38.7) | 267 (84) | 304 (95.6) | 209 (65.7) | 192 (60.4) |
| Site has modality and uses PACS for images | 280 (88.1) | 191 (60.1) | 47 (14.8) | 10 (3.1) | 105 (33) | 122 (38.4) |
| Site does not have modality and cannot access images via PACS | 4 (1.3) | 4 (1.3) | 4 (1.3) | 4 (1.3) | 4 (1.3) | 4 (1.3) |
CT = computed tomography; MRI = magnetic resonance imaging; PACS = picture archiving and communication system; PET = positron emission tomography; PET-CT = positron emission tomography–computed tomography; PET-MRI = positron emission tomography–magnetic resonance imaging; SPECT = single-photon emission computed tomography; SPECT-CT = single-photon emission computed tomography–computed tomography.
Table 66: PACS Images Access to Referring Physicians and Access Without Manual Retrieval
| PACS extent | PACS images accessible to referring physicians | PACS images accessible throughout provincial or territorial health care system without manual retrieval | ||
|---|---|---|---|---|
| Yes | No | Yes | No | |
| Number of sites (%) | ||||
| Local | 83 (90.2) | 9 (9.8) | 64 (71.9) | 25 (28.1) |
| Provincial | 120 (100) | 0 (0) | 118 (98.3) | 2 (1.7) |
| Regional | 94 (100) | 0 (0) | 63 (68.9) | 28 (31.1) |
| Total | 297 (97.1) | 9 (2.9) | 244 (81.6) | 55 (18.4) |
PACS = picture archiving and communication system.
Note: Data derived from the survey questions: “Do referring physicians have access to PACS images in areas of the hospital outside of diagnostic imaging (e.g., hospital clinics, the OR, case rounds meeting rooms, etc.)?” “Are PACS images routinely accessible throughout your provincial health care system without the need to manually push images from any particular location/modality?”
Appropriateness of Orders Received
In response to a question about whether sites have a process to determine the appropriateness of received orders, 218 (84.5%) out of a total of 258 sites responded “yes,” and 40 (15.5%) sites responded “no.” A summary of the process used is provided in Table 67.
When there was a process to determine the appropriateness of the orders, sites were asked to report whether the process they use is reviewed by one or more of the following: radiologist, technologist, computer-aided order entry, or other. Among the 185 sites that reported this information, radiologist review was the most commonly adopted appropriateness process, with 173 (93.5%) sites using it, followed by technologist review, with 100 (54.1%) sites using this process, 11 (5.9%) sites using computer-aided order entry, and eight (4.3%) sites using a process reported as “other.”
Table 67: Percentage Use of Appropriate Use Process by Province and Territory
| Province and territory | Any methods | Radiologist review | Technologist review | Computer-aided order entry | Other |
|---|---|---|---|---|---|
| Number of sites (%) | |||||
| Alberta | 44 (100) | 44 (100) | 7 (15.9) | 1 (2.3) | 0 (0) |
| British Columbia | 38 (100) | 34 (89.5) | 22 (57.9) | 1 (2.6) | 3 (7.9) |
| Manitoba | 16 (100) | 15 (93.8) | 15 (93.8) | 1 (6.2) | 0 (0) |
| New Brunswick | 4 (100) | 4 (100) | 3 (75) | 0 (0) | 0 (0) |
| Newfoundland and Labrador | 7 (100) | 7 (100) | 7 (100) | 0 (0) | 0 (0) |
| Northwest Territories | 1 (100) | 1 (100) | 1 (100) | 0 (0) | 0 (0) |
| Nova Scotia | 11 (100) | 11 (100) | 8 (72.7) | 1 (9.1) | 0 (0) |
| Nunavut | NR | NR | NR | NR | NR |
| Ontario | 38 (100) | 34 (89.5) | 25 (65.8) | 6 (15.8) | 3 (7.9) |
| Prince Edward Island | 2 (100) | 2 (100) | 1 (50) | 0 (0) | 0 (0) |
| Quebec | 15 (100) | 12 (80) | 7 (46.7) | 0 (0) | 2 (13.3) |
| Saskatchewan | 8 (100) | 8 (100) | 3 (37.5) | 1 (12.5) | 0 (0) |
| Yukon | 1 (100) | 1 (100) | 1 (100) | 0 (0) | 0 (0) |
| Canada | 185 (100) | 173 (93.5) | 100 (54.1) | 11 (5.9) | 8 (4.3) |
NR = not reported.
Note: Data derived from the survey question: “What process is used to determine the appropriateness of orders received?”
Canadian Data Compared With International Data
The availability of unit count and use data allowed us to compare the Canadian data we collected with international data from the OECD.22 Last observation carried forward was used for all countries to impute values for comparison with the CMII 2020 data.
Computed Tomography
Among the 37 OECD countries with information, Canada ranked 30th in CT units per million population, based on the statistics in the years with the latest information (Figure 18).
Figure 18: Comparison of Canadian and International Data for Computed Tomography Scanners, Total (Per Million Population)
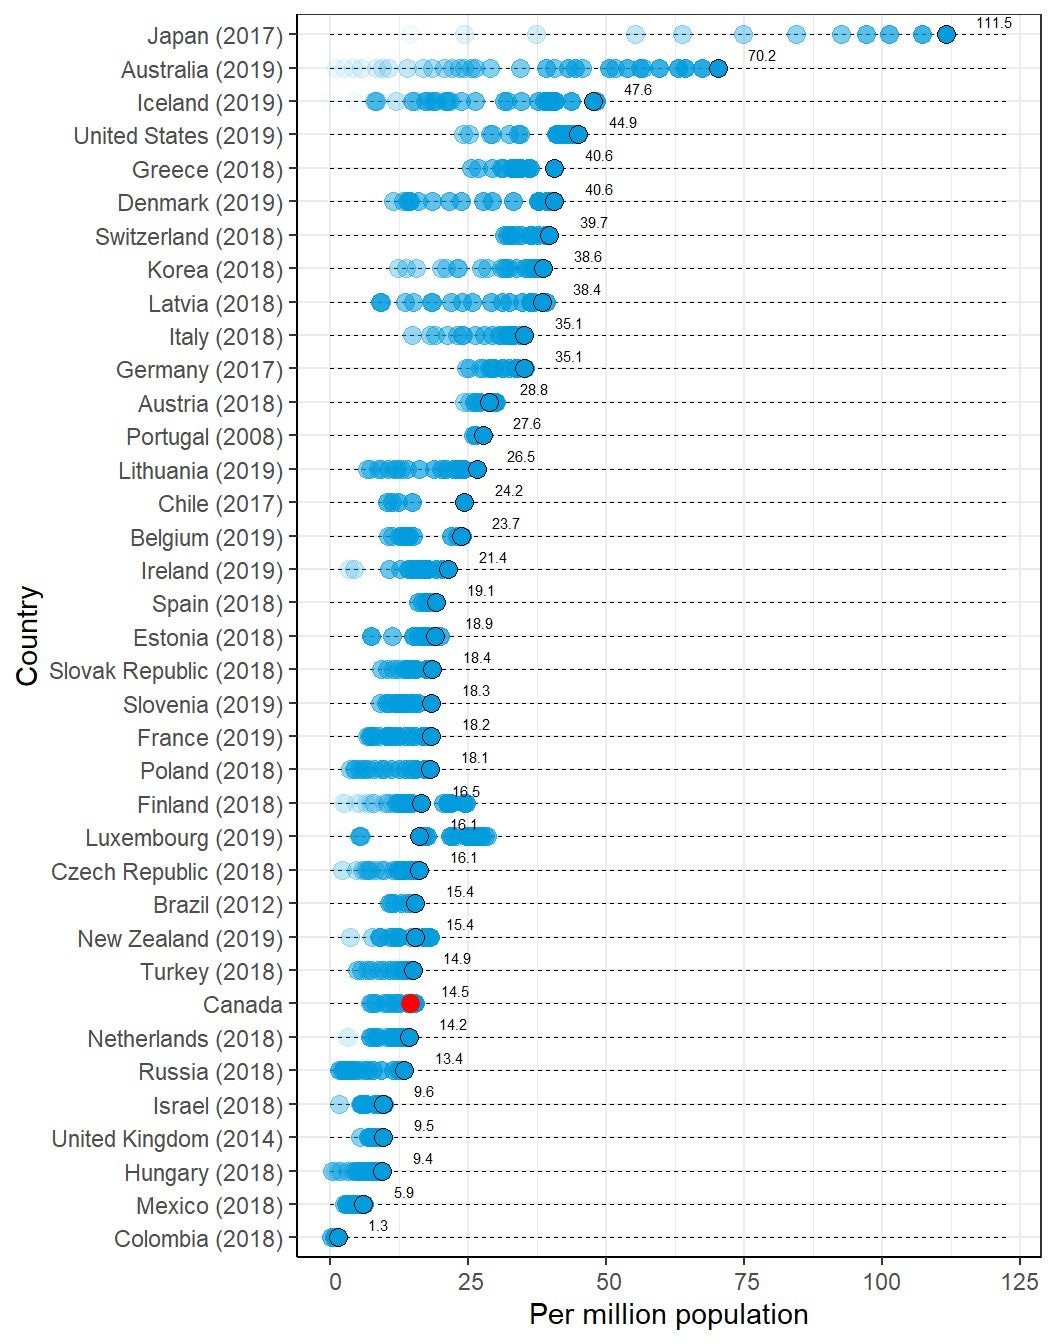
OECD = Organisation for Economic Co-operation and Development.
Note: The year is the last year with data available; black circle shows the data in the last year (red for Canada); blue dots show OECD data from all available years (see https://stats.oecd.org/ for details). Each dot represents the data in a year and may overlap with other dots. Lighter dots represent older data. OECD data retrieved on January 6, 2020.
Numbers of CT Exams
Among the 29 OECD countries with information, Canada ranked 16th in the volume of CT exams per thousand population, based on the statistics in the years with the latest information (Figure 19).
Figure 19: Comparison of Canadian and International Data for Computed Tomography Exams, Total (Per Thousand Population)
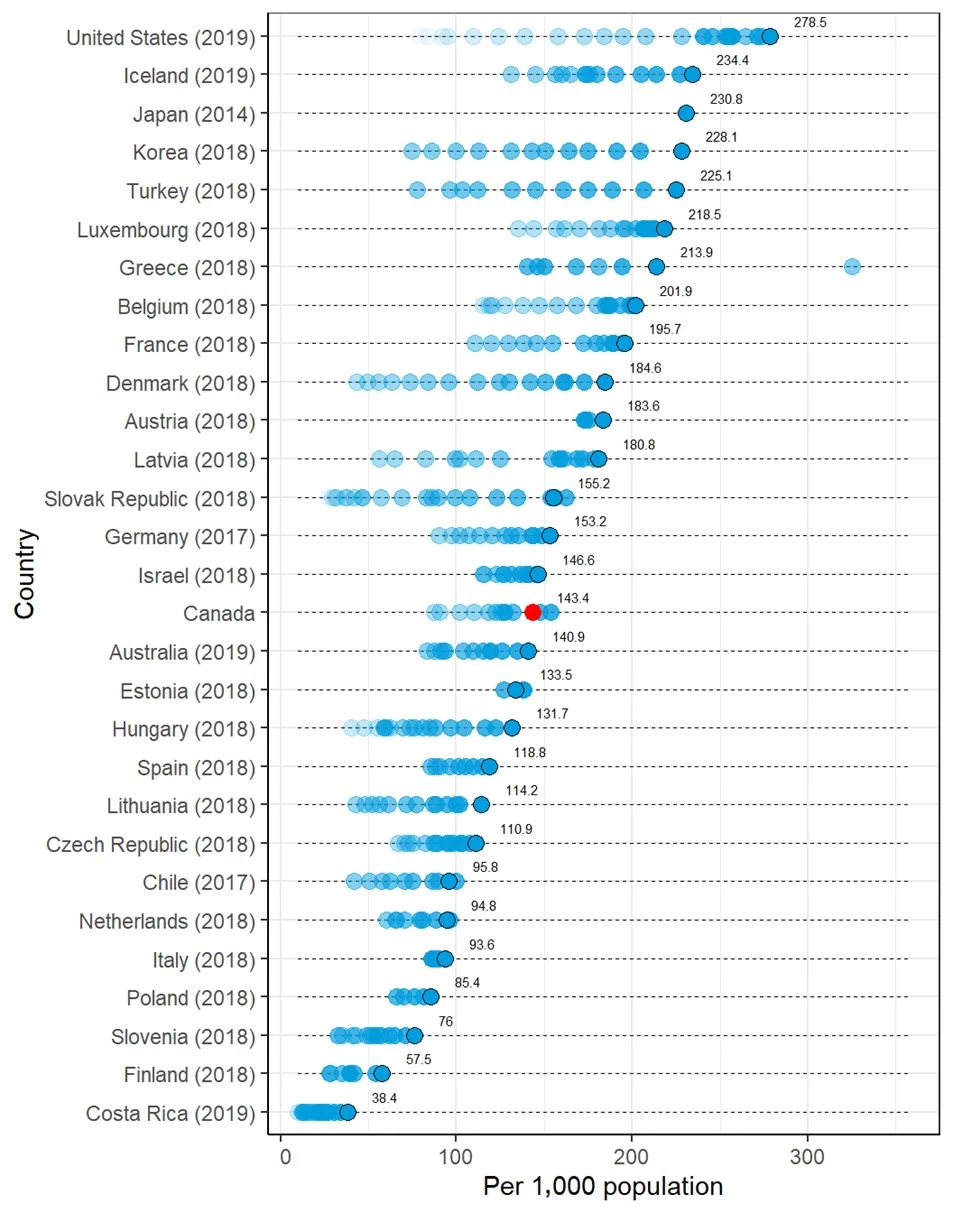
OECD = Organisation for Economic Co-operation and Development.
Note: The year is the last year with data available; black circle shows the data in the last year (red for Canada); blue dots show OECD data from all available years (see https://stats.oecd.org/ for details). Each dot represents the data in a year and may overlap with other dots. Lighter dots represent older data. OECD data retrieved on January 6, 2020.
Magnetic Resonance Imaging
Among the 36 OECD countries with information, Canada ranked 26th in MRI units per million population, based on the statistics in the years with the latest information (Figure 20).
Figure 20: Comparison of Canadian and International Data for Magnetic Resonance Imaging Units, Total (Per Million Population)
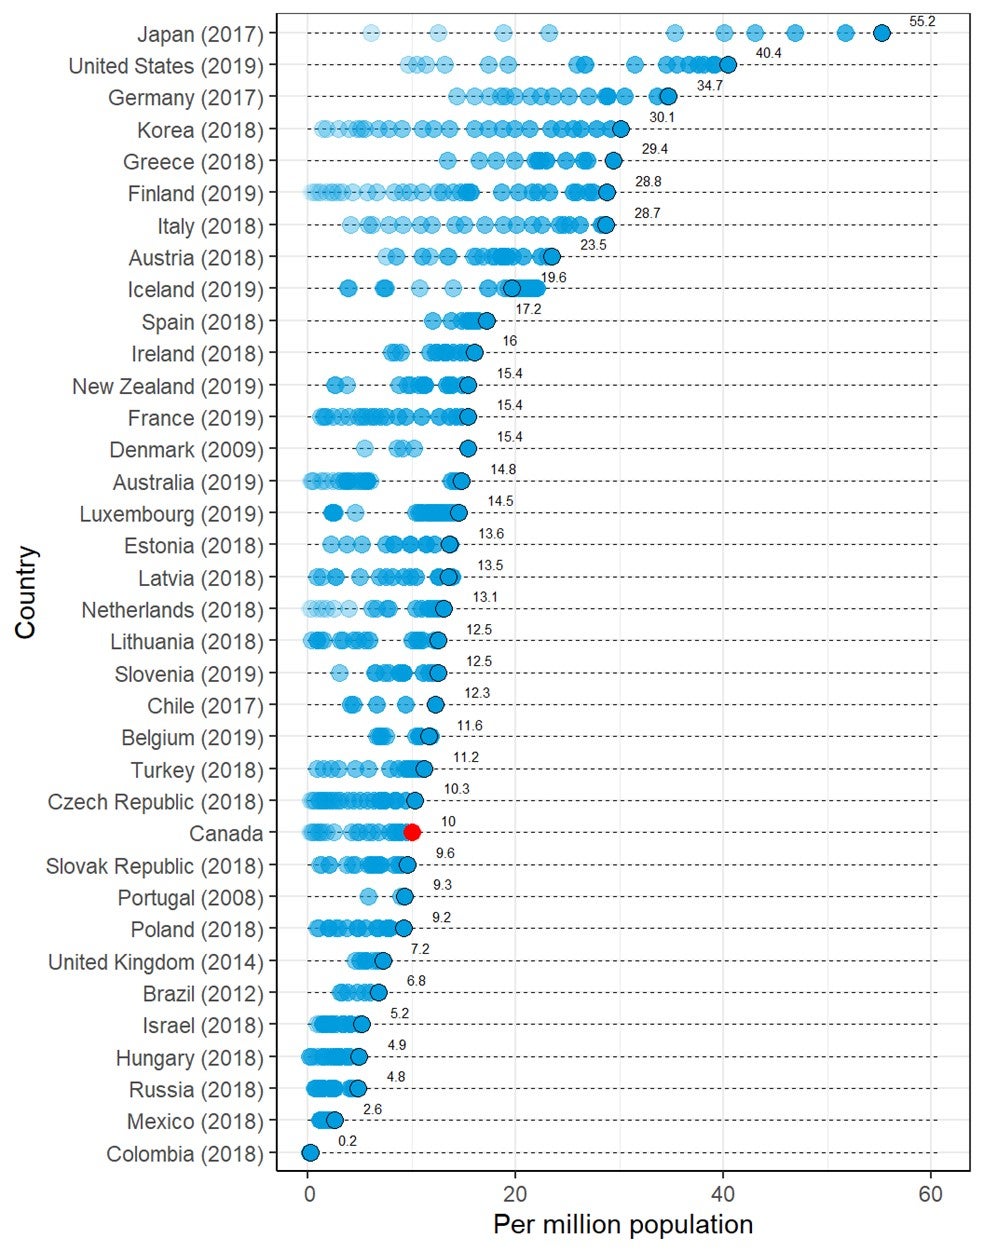
OECD = Organisation for Economic Co-operation and Development.
Note: The year is the last year with data available; black circle shows the data in the last year (red for Canada); blue dots show OECD data from all available years (see https://stats.oecd.org/ for details). Each dot represents the data in a year and may overlap with other dots. Lighter dots represent older data. OECD data retrieved on January 6, 2020.
Numbers of MRI Exams
Among the 27 OECD countries with information, Canada ranked 16th in volume of MRI exams per thousand population, based on the statistics in the years with the latest information (Figure 21).
Figure 21: Comparison of Canadian and International Data for Magnetic Resonance Imaging Exams, Total (Per Thousand Population)
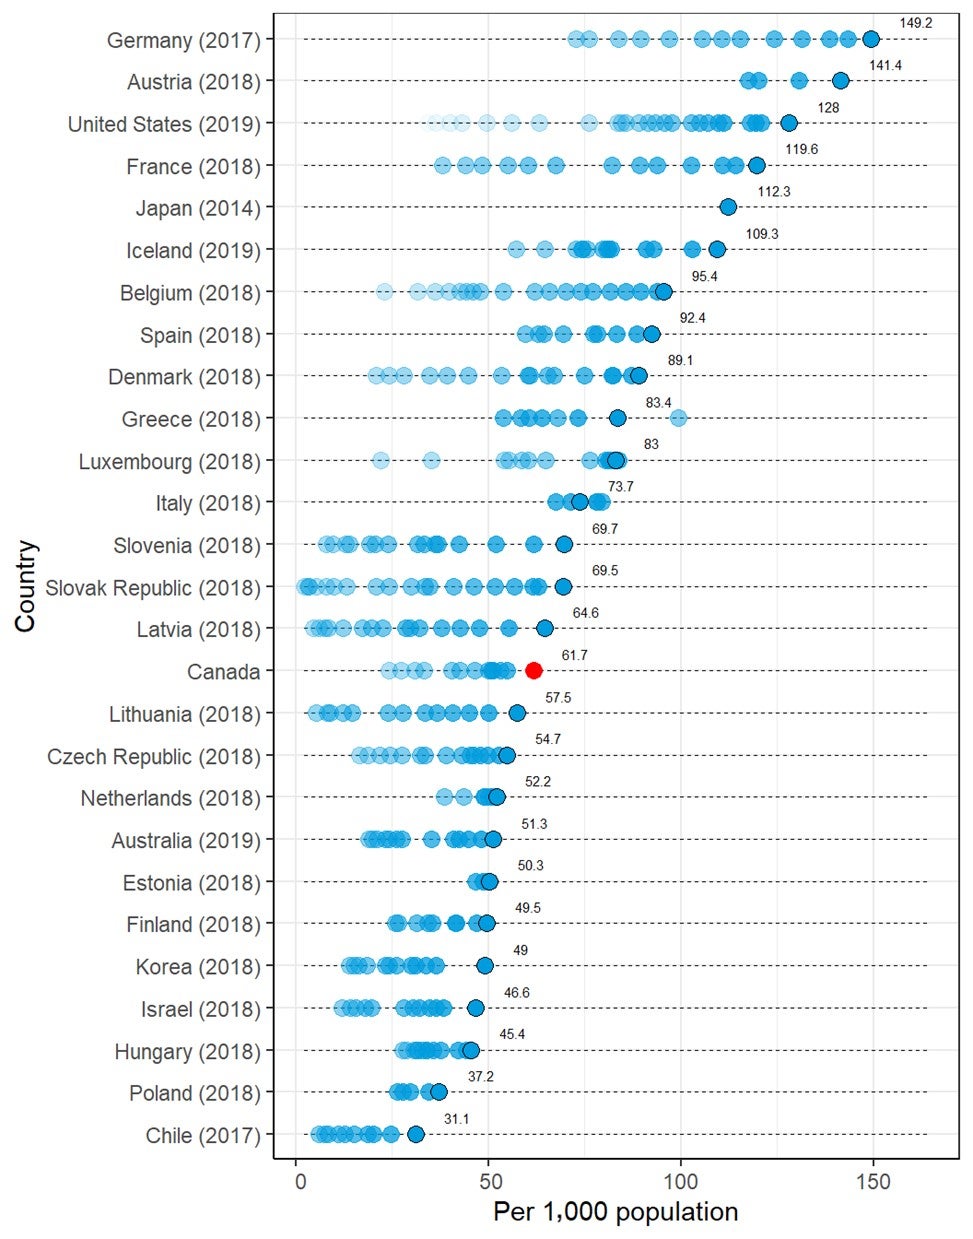
OECD = Organisation for Economic Co-operation and Development.
Note: The year is the last year with data available; black circle shows the data in the last year (red for Canada); blue dots show OECD data from all available years (see https://stats.oecd.org/ for details). Each dot represents the data in a year and may overlap with other dots. Lighter dots represent older data. OECD data retrieved on January 6, 2020.
Positron Emission Tomography
Among the 33 OECD countries with information, Canada ranked 21st in PET or PET-CT units per million population, based on the statistics in the years with the latest information (Figure 22).
Figure 22: Comparison of Canadian and International Data for PET or PET-CT Scanners, Total (Per Million Population)
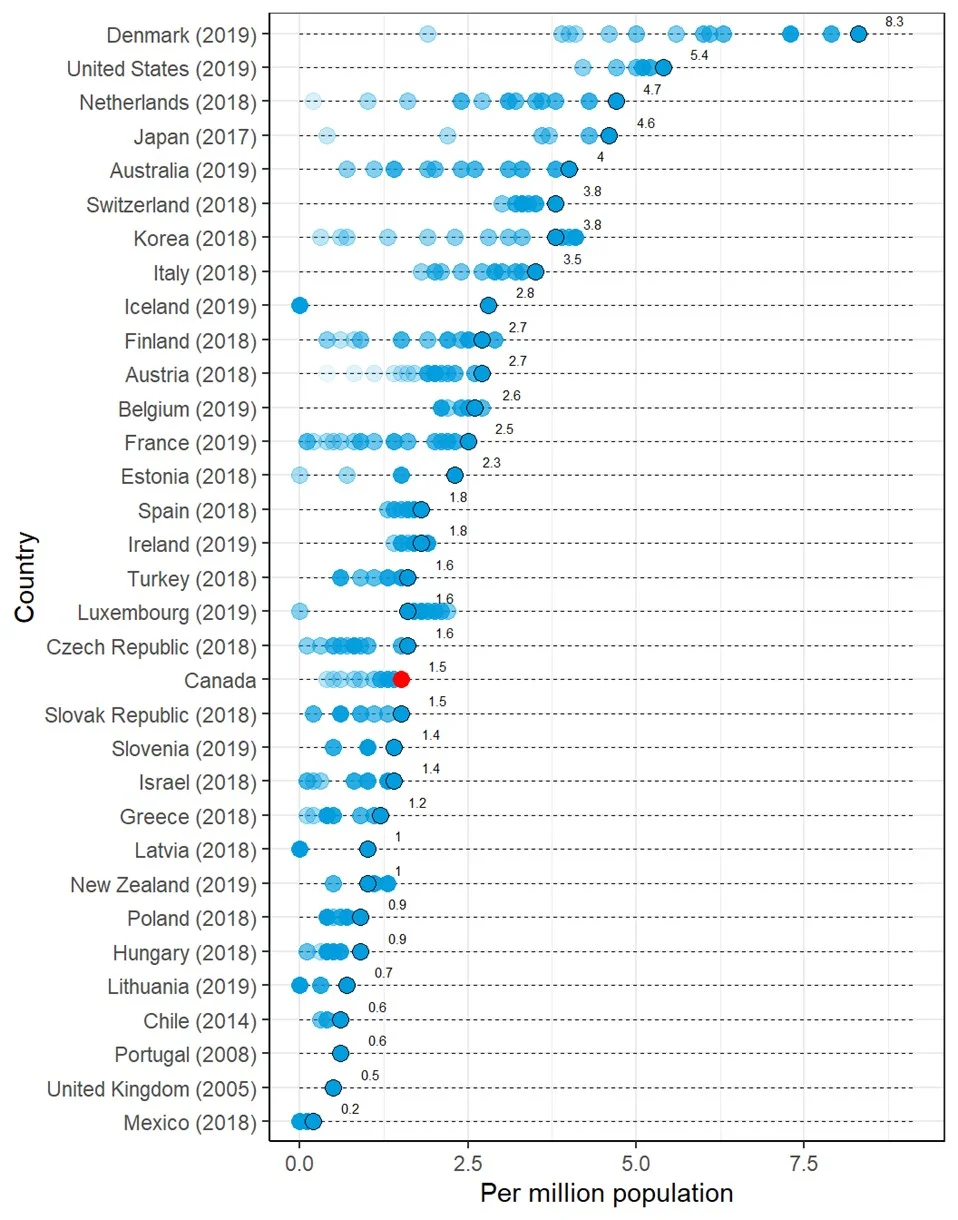
OECD = Organisation for Economic Co-operation and Development.
Note: The year is the last year with data available; black circle shows the data in the last year (red for Canada); blue dots show OECD data from all available years (see https://stats.oecd.org/ for details). Each dot represents the data in a year and may overlap with other dots. Lighter dots represent older data. OECD data retrieved on January 6, 2020.
Numbers of PET Exams
Among the 25 OECD countries with information, Canada ranked 16th in the volume of PET or PET-CT exams per thousand population, based on the statistics in the years with the latest information (Figure 23).
Figure 23: Comparison of Canadian and International Data for PET and PET-CT Exams, Total (Per Thousand Population)
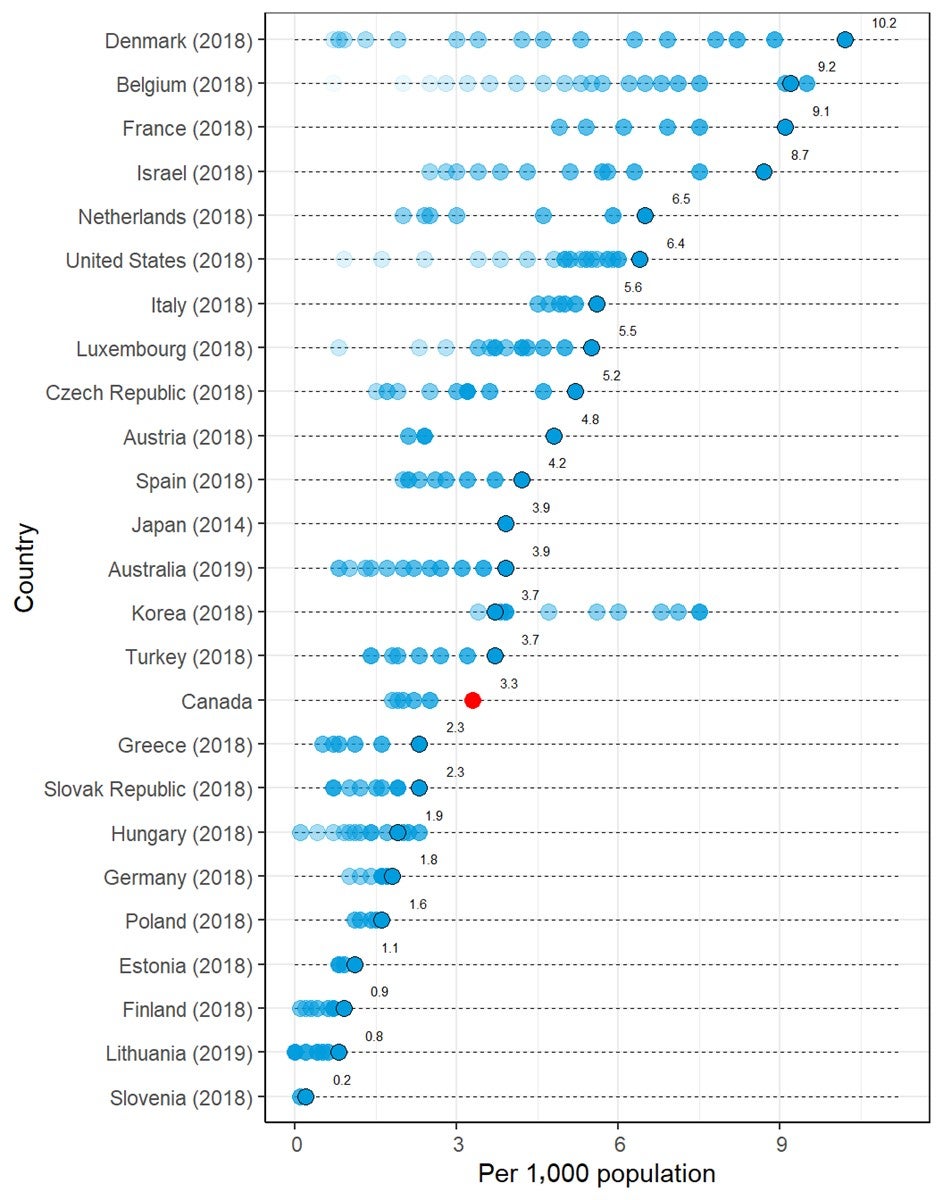
OECD = Organisation for Economic Co-operation and Development.
Note: The year is the last year with data available; black circle shows the data in the last year (red for Canada); blue dots show OECD data from all available years (see https://stats.oecd.org/ for details). Each dot represents the data in a year and may overlap with other dots. Lighter dots represent older data. OECD data retrieved on January 6, 2020.
Sources of Funding for Imaging Equipment
Jurisdictional validators were asked to report on sources of funding for imaging equipment. Responses are summarized in Table 68. Overall, most provinces receive the majority of their funding from publicly funded provincial sources. In Nova Scotia, the Northwest Territories, and Nunavut, all funding for imaging equipment is centralized through publicly funded health plans. In four provinces (Alberta, Manitoba, New Brunswick, and Newfoundland and Labrador), 90% to 95% of all funding originates from provincial or regional public health plans, and the remaining funding is from philanthropic donations or hospital foundations. Yukon relies on territorial funding for 90% to 100% of imaging equipment, depending on the imaging modality type. Charitable donations are the main source of funding for imaging equipment in Saskatchewan and Prince Edward Island, with 65% and 85% of their total funding, respectively, originating from this source and the rest from provincial funding.
In British Columbia, there are many variables involved in determining funding sources and the percentage of funding originating from those sources for medical imaging equipment. As well, funding differs depending on the type of imaging equipment. Additional variables include the following:
- Some, but not all, hospitals are part of Regional Hospital Districts that may assist with funding.
- Hospitals may have foundations that contribute to imaging equipment funding, although smaller hospitals may not be assisted by hospital foundations.
- Health authorities may use internal sources of funding to support imaging equipment.
- In some instances, imaging equipment may be part of a larger hospital redevelopment/replacement project.
In Ontario, although hospitals are responsible for purchasing decisions, funding for new equipment originates from both provincial sources as well as charitable donations for CT and MRI.
No data were available for Quebec, and data for Ontario were limited to funding for CT and MRI. As well, for New Brunswick, the responses came from one of the two regional health authorities, the Horizon Health Network.
Table 68: Sources of Funding for Imaging Equipment
| Province or territory | Provincial funding, % |
Charitable donation, % |
Stimulus program, % |
Research program, % |
|---|---|---|---|---|
| Alberta | 90 | 10 | 0 | 0 |
| British Columbia | There are many variables involved in determining funding sources and the percentage of funding coming from those sources for medical imaging equipment. This also depends on the type of imaging equipment (CT, MRI, PET, SPECT), which are all funded in various ways with no standard across the imaging types. Additional variables include the following:
|
|||
| Manitoba | 95 | 5 | 0 | 0 |
| New Brunswicka | 90 | 10 | 0 | 0 |
| Newfoundland and Labrador | 90 | 0 | 0 | 0 |
| 10% hospital foundation | ||||
| Northwest Territories | 100 | 0 | 0 | 0 |
| Nova Scotia | 100 | 0 | 0 | 0 |
| Nunavut | 100 | 0 | 0 | 0 |
| Ontariob | While hospitals are solely responsible for equipment purchases, funding originates from provincial sources, i.e., from the hospital’s government-funded annual budgets and/or charitable donations (e.g., funds raised by hospital foundations). | 0 | 0 | |
| Prince Edward Island | 15 | 85 | 0 | 0 |
| Quebec | NR | NR | NR | NR |
| Saskatchewan | 35 | 65 | 0 | 0 |
| Yukon | 90 to 100, depending on modality | 0 to 10, depending on modality | 0 | 0 |
NR = no response.
a Horizon Health.
b For CT and MRI only.
Note: Data from question: “What are the sources of funding for imaging equipment at your site?”
Volume of Publicly Funded Exams Conducted in Private Settings
Provincial and territorial validators were asked to report on the percentage of publicly funded exams performed in private settings for CT and MRI. Overall, there is a low volume of publicly funded exams conducted in private settings. Two provinces conduct publicly funded CT exams in private settings, including Saskatchewan and Ontario, with 20% of CT exams in Saskatchewan and 2.5% of those in Ontario conducted in private settings. Three provinces conduct publicly funded MRI exams in private settings, including Alberta, Saskatchewan, and Ontario, accounting for 1% to 2%, 5%, and 25% of the volume of exams in those provinces, respectively. No data were available for Quebec.
Factors That Inform Decision-Making About Replacing, Upgrading, and Adding New Imaging Equipment
Jurisdictional validators were asked to prioritize criteria that influence decision-making on replacing, upgrading, and/or adding new imaging equipment. Priorities were assigned numerically by ranking criteria from one to nine, with one representing the highest priority and nine representing the lowest. Overall, the responses were variable across all provinces. Table 69 and Figure 24 provide summaries of the complete responses for this question.
For the placement of new equipment, evolving clinical practice and increased patient demand appear to have a moderate to high influence on decisions for the acquisition of new equipment. The main drivers for decisions to replace existing equipment are equipment age, end of manufacturer support, and equipment failure. The main driver for decisions to upgrade imaging equipment were end of manufacturer support. Radiation dose reduction did not appear to have a strong influence on decisions to acquire new equipment or replace existing equipment.
Table 69: Factors That Inform Decisions About Replacing, Upgrading, or Adding New Imaging Equipment
| Evolving clinical practice, guidelines/evidence | |||||||||||||
|---|---|---|---|---|---|---|---|---|---|---|---|---|---|
| Decision | AB | BC | MB | NB | NL | NS | NT | NU | ONa | PE | QC | SK | YT |
| New | 1 | 3 | 2 | 2 | 8 | 1 | 1 | 3 | 2 | NR | 2 | NA | |
| Replace | 3 | 7 | 4 | 4 | 8 | 6 | 5 | 7 | 7 | NR | 6 | 8 | |
| Upgrade | NR | 8 | 3 | 2 | 8 | 1 | 4 | 3 | 8 | NR | 6 | NA | |
| Equipment age (in general and as per Canadian Association of Radiologists guidelines) | |||||||||||||
| Decision | AB | BC | MB | NB | NL | NS | NT | NU | ONa | PE | QC | SK | YT |
| New | NR | NA | NR | NA | 4 | 8 | 8 | NA | 8 | NR | 4 | NA | |
| Replace | 4 | 4 | 3 | 8 | 4 | 1 | 1 | 3 | 1 | NR | 1 | 3 | |
| Upgrade | 3 | 4 | 4 | NA | 4 | 6 | 3 | 6 | 2 | NR | 1 | NA | |
| End of manufacturer support/obsolescence/reduced availability of parts | |||||||||||||
| Decision | AB | BC | MB | NB | NL | NS | NT | NU | ONa | PE | QC | SK | YT |
| New | NA | NR | NR | NA | 1 | 7 | 7 | NA | 7 | NR | 5 | NA | |
| Replace | 2 | 3 | 1 | 3 | 1 | 3 | 2 | 2 | 2 | NR | 2 | 1 | |
| Upgrade | 1 | 3 | 1 | NA | 1 | 7 | 1 | 4 | 1 | NR | 2 | NA | |
| Equipment failure/reliability/downtime | |||||||||||||
| Decision | AB | BC | MB | NB | NL | NS | NT | NU | ONa | PE | QC | SK | YT |
| New | NR | NA | NR | NA | 2 | 6 | 6 | NA | 5 | NR | 6 | NA | |
| Replace | 1 | 1 | 2 | 1 | 2 | 2 | 3 | 5 | 4 | NR | 4 | 4 | |
| Upgrade | NR | 1 | 2 | NA | 2 | 8 | 2 | 7 | 4 | NR | 4 | NA | |
| Evolving patient volumes/demographics/clinical demand | |||||||||||||
| Decision | AB | BC | MB | NB | NL | NS | NT | NU | ONa | PE | QC | SK | YT |
| New | 2 | 1 | 1 | 1 | 7 | 2 | 2 | 2 | 1 | NR | 1 | NA | |
| Replace | 7 | 4 | 6 | 5 | 7 | 7 | 6 | 4 | 6 | NR | 5 | 7 | |
| Upgrade | NR | 6 | 1 | 7 | 3 | 5 | 2 | 7 | NR | 5 | NA | ||
| Capital/operational budget | |||||||||||||
| Decision | AB | BC | MB | NB | NL | NS | NT | NU | ONa | PE | QC | SK | YT |
| New | NR | 2 | NR | NA | 5 | 3 | 3 | 1 | 6 | NR | 3 | NA | |
| Replace | 5 | 2 | 8 | 2 | 5 | 8 | 4 | 1 | 8 | NR | 3 | 2 | |
| Upgrade | 2 | 2 | 8 | NA | 5 | 4 | 6 | 1 | 6 | NR | 3 | NA | |
| Service repair budget | |||||||||||||
| Decision | AB | BCb | MB | NB | NL | NS | NT | NU | ONa | PE | QC | SK | YT |
| New | NR | NR | NA | 3 | 4 | 4 | NA | 4 | NR | NR | NA | ||
| Replace | 8 | 7 | 7 | 3 | 4 | 7 | 8 | 5 | NR | 7 | 5 | ||
| Upgrade | NR | 7 | NA | 3 | 5 | 7 | 8 | 5 | NR | 7 | NA | ||
| Radiation dose reduction | |||||||||||||
| Decision | AB | BC | MB | NB | NL | NS | NT | NU | ONa | PE | QC | SK | YT |
| New | 8 | 4 | NR | NA | 6 | 5 | 9 | NA | 3 | NR | NR | NA | |
| Replace | 6 | 8 | 5 | 6 | 6 | 5 | 8 | 6 | 3 | NR | 8 | 6 | |
| Upgrade | NR | 7 | 5 | 3 | 6 | 2 | 8 | 5 | 3 | NR | 8 | NA | |
| Other | |||||||||||||
| Decision | AB | BC | MB | NB | NL | NS | NT | NU | ONa | PE | QC | SK | YT |
| New | NR | NR | NR | NR | 9 | NR | 5 | NA | NR | NR | NR | NA | |
| Replace | NR | NR | NR | NR | 9 | NR | 9 | NA | NR | NR | NR | 9 | |
| Upgrade | NR | NR | NR | NR | 9 | NR | 9 | NA | NR | NR | NR | NA | |
AB = Alberta; BC = British Columbia; MB = Manitoba; NA = not applicable; NB = New Brunswick; NL = Newfoundland and Labrador; NR = no response; NS = Nova Scotia; NT = Northwest Territories, NU = Nunavut; ON = Ontario; PE = Prince Edward Island; QC = Quebec; SK = Saskatchewan; YT = Yukon.
a In Ontario, these decisions are left up to hospitals and Independent Health Facilities. The Ontario Ministry of Health does not set guidelines or criteria that hospitals must follow regarding decisions on imaging equipment. These decisions are relevant for CT and MRI.
b Falls under operational budget.
Note: 1 = most important, 9 = least important. Data from question: “When making decisions about replacing, upgrading, or adding new imaging equipment, what are the main drivers that dictate jurisdictional decisions?”
Figure 24: Priorities That Inform Decisions About Replacing, Upgrading, Or Adding New Imaging Equipment — Main Drivers That Dictate Jurisdictional Decisions
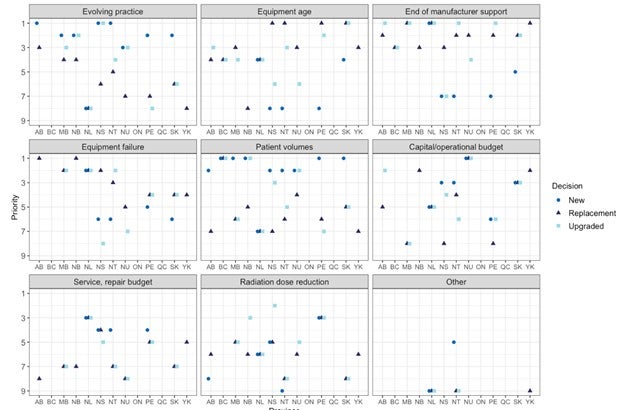
AB = Alberta; BC = British Columbia; MB = Manitoba; NB = New Brunswick; NL = Newfoundland and Labrador; NS = Nova Scotia; NT = Northwest Territories, NU = Nunavut; ON = Ontario; PE = Prince Edward Island; QC = Quebec; SK = Saskatchewan; YK = Yukon.
Note: Overlapping points have been offset from each other in the horizontal direction.
Criteria Used to Expand Imaging Equipment to New Geographic Locations
Provincial and territorial validators were asked to report the criteria they use when making decisions about expanding imaging modalities to geographic locations where equipment did not previously exist. Responses are summarized in Table 70. Increased patient volume is a criterion considered by all jurisdictions for expanding imaging modalities to new geographic locations. Four jurisdictions reported that travel distance was an important consideration. Three jurisdictions each reported site readiness (existing service levels), alignment with other programs or health authority priorities, and funding or operational constraints as criteria used when making decisions about the placement of equipment in new geographic locations. Two jurisdictions each reported demographic changes, shifting patient referral patterns, and health human resources as important criteria. Other considerations included the physical footprint required for new equipment, capacity at alternate locations, and alignment with best practices.
Data for Ontario were limited to CT and MRI, and no data were available for Quebec. As well, for New Brunswick, the responses came from one of the two regional health authorities, the Horizon Health Network.
Table 70: Criteria Used to Expand Imaging Modalities to New Geographic Locations
| Province or territory | Criteria used |
|---|---|
| Alberta | Clinical service levels at facility, population of community served, patient referral patterns, alignment with other programs (i.e., stroke plan) |
| British Columbia |
Population increase/need (current level of access: exams per 100,000 population in the health service delivery area or community health service area and travel times for imaging services before expansion of services) Health human resource availability for staffing and case load variety to maintain competencies (particularly for allied health technologists) Site readiness to add imaging modalities, and health authority priority/tiers of service level of the hospital where imaging would be sited |
| Manitoba | Patient volume, accessibility, demographics, clinical services |
| New Brunswicka | Demand for new services that cannot be absorbed within a reasonable distance from the patient’s home location |
| Newfoundland and Labrador | Geographical population and population health care needs, as well as following best practices guideline on service required |
| Northwest Territories | Patient volume, cost reduction strategy — offering the service at this location would save the system money |
| Nova Scotia | Demand for service, population growth, and capacity at current location |
| Nunavut | Patient volume and funding |
| Ontariob | Estimated current and future demand |
| Prince Edward Island | Demand for service, physical footprint and location, operational costs, staffing availability, funding, population of catchment area, hours of operation |
| Quebec | NR |
| Saskatchewan | Demographic changes and anticipated volume, goal to limit patient travel time, operational and capital funding restrains, and alignment with other clinical services available in a geographic region |
| Yukon | NA |
NA = not applicable; NR = no response.
a Horizon Health.
b For CT and MRI only.
Note: Data derived from the question: “What criteria are used when expanding imaging modalities into new geographic locations where they did not previously exist?”
Use of Teleradiology Services
Provincial and territorial validators were asked to report the use of teleradiology services. Overall, the use of teleradiology services is common in Canada, although most services are contained within jurisdictional boundaries. Eight jurisdictions reported using teleradiology services within their borders, six jurisdictions reported using out-of-province teleradiology services, and one province, Quebec, uses teleradiology services based outside of Canada. Responses are summarized in Table 71.
Table 71: Use of Teleradiology Services
| Province or territory | Provincially based | Out-of-province | Out-of-country |
|---|---|---|---|
| Alberta | Yes | Yes I |
No |
| British Columbia | Yes | No | No |
| Manitoba | Yes | No | No |
| New Brunswicka | Yes | No | No |
| Newfoundland and Labrador | No | No | No |
| Northwest Territories | No | Yes | No |
| Nova Scotia | No | No | No |
| Nunavut | Yes | Yes | No |
| Ontario | Yes | No | No |
| Prince Edward Island | No | No | No |
| Quebec | Yes | Yes | Yes |
| Saskatchewan | Yes | Yes | No |
| Yukon | No | Yes | No |
Note: Data derived from the question: “Are teleradiology services used in your jurisdiction?”
Length of Time Taken to Review and Approve Designations for CT and PET-CT in New Sites
The length of time and approval process for installing and operating CT and PET-CT differs across Canada and, in some instances, depends on a variety of factors. Provincial and territorial validators were asked to report on the length of time it takes to review and approve a CT or PET-CT designation for the use of these modalities at new sites. Responses are summarized in Table 72. Four jurisdictions provided details on the duration of reviews and approvals, which ranged from one to three years. Four additional jurisdictions reported that the length of time for the review and approval of a designation varies, depending on factors such as program alignment, credentialing processes, and funding sources, and that these factors may differ between modalities.
Table 72: Factors Affecting the Length of Time for Review and Approval of Designations for CT and PET-CT in New Sites
| Province or territory | Criteria used |
|---|---|
| Alberta | Depends on various factors, including zone program alignment and funding source |
| British Columbia | Varies greatly depending on the site and differs significantly between CT and PET-CT |
| Manitoba | 52 weeks |
| New Brunswick | CT and PET/CT designations are not required in the province of NB |
| Newfoundland and Labrador | The implementation of the service was initiated by the government; time unknown |
| Northwest Territories | NA |
| Nova Scotia | Dependant on the organization’s credentialing process |
| Nunavut | 3 years |
| Ontario | NR |
| Prince Edward Island | 60 to 70 weeks |
| Quebec | NR |
| Saskatchewan | 156 weeks |
| Yukon | NA |
NA = not applicable; NR = not reported.
Note: Data derived from the question: “Approximately how long does it take (in weeks) to review and approve a CT or PET/CT designation for the use of these modalities at a new site?”
Medical Imaging Team
Advanced medical imaging teams usually comprise multidisciplinary professionals, including radiologists, nuclear medicine specialists, medical physicists (specifically, imaging medical physicists), MRTs, biomedical engineers, and other support staff. These skilled professionals work collaboratively to provide numerous services, including preparing patients for exams; designing, installing, operating, and maintaining equipment; radiation safety and quality assurance; reading and interpreting exams; and performing numerous other functions to manage the day-to-day operations of an imaging department.19 Close collaboration between team members is required to deliver optimal patient care; advance a better understanding of the policies, practices and protocols for specific exams; and promote appropriate imaging.26,27
The size, composition, distribution, and interrelationships among these professionals vary, depending on the type of imaging facility, its size, its geographical location, and the expertise required to perform specific exams.19
The greatest overall number of full-time medical imaging staff for the main team members working in imaging departments (radiologists, nuclear medicine specialists, imaging medical physicists, and MRTs) is in Ontario, Quebec, British Columbia, and Alberta. Responses are summarized in Table 73 by province for radiologists, nuclear medicine specialists, imaging medical physicists, and MRTs. There are radiologists in all the provinces, with the number per province ranging from 5.9 per thousand population in Prince Edward Island to 9.9 per thousand population in Newfoundland and Labrador.28 Nuclear medicine specialists have a presence in all provinces, apart from Prince Edward Island. The number of nuclear medicine specialists per province ranges from 0.4 per thousand population, in both Manitoba and New Brunswick, to 1.3 per thousand population, in Quebec.29 There may be some overlap, with individuals identified as both radiologists and nuclear medicine specialists due to a trend in hiring dual Canadian Royal College fellowship-trained doctors in both nuclear medicine and radiology. There are MRTs in all provinces, while the number in the territories is not reported. The number of MRTs per province ranges from 42.6 per thousand population, in British Columbia, to 78.5 per thousand population, in Quebec.30 The number of imaging medical physicists is low across Canada, and four provinces do not have designated certified imaging medical physicists. For these provinces, the work of an imaging medical physicist may be done by an academic imaging physicist, a non-certified imaging physicist, someone else, or perhaps not at all (Dr. Thor Bjarnason MCCPM, PEng, Canadian Organization of Medical Physicists Imaging Committee Chair: personal communication, September 17, 2020). Overall, there are 1.2 certified imaging medical physicists per million population in Canada.31
Table 73: Number of Radiologists, Nuclear Medicine Specialists, Medical Radiation Technologists, and Imaging Medical Physicists in Canada in 2018
| Province or territory | Radiologists28 | Nuclear medicine specialists29 | Medical radiation technologists30 | Imaging medical physicistsa | ||||
|---|---|---|---|---|---|---|---|---|
| Count | Per million population | Count | Per million population | Count | Per million population | Count | Per million population | |
| Alberta | 294 | 65.7 | 28 | 6.3 | 2,416 | 540.2 | 7 | 1.6 |
| British Columbia | 314 | 61.5 | 29 | 5.7 | 2,128 | 417.0 | 9 | 1.8 |
| Manitoba | 88 | 63.6 | 6 | 4.3 | 841 | 608.6 | 5 | 3.6 |
| New Brunswick | 57 | 73.5 | 3 | 3.9 | 595 | 767.1 | 0 | 0.0 |
| Newfoundland and Labrador | 52 | 99.6 | 5 | 9.6 | 396 | 758.2 | 1 | 1.9 |
| Nova Scotia | 85 | 87.9 | 8 | 8.3 | 609 | 629.7 | 2 | 2.1 |
| Ontario | 939 | 64 | 79 | 5.4 | 10,720 | 730.3 | 18 | 1.2 |
| Prince Edward Island | 9 | 57.2 | 0 b | 0.0 | 113 | 718.0 | 0 c | 0.0 |
| Quebec | 661 | 77.8 | 107 | 12.6 | 6,587 | 775.4 | 5 | 0.6 |
| Saskatchewan | 83 | 69.5 | 6 | 5.0 | 628 | 525.0 | 0 | 0.0 |
| Territories | 0 | 0 | 0 | 0.0 | NR | 0.0 | 0 | 0.0 |
| Canada | 2,582 | 68.2 | 271 | 7.2 | 25,033 | 661.0 | 47 | 1.2 |
NR = not reported.
a Gisele Kite, Administrator, Canadian Organization of Medical Physicists, ON: personal communication, September 17, 2020).
b Although not reported by the Canadian Medical Association, there is one radiologist practising in Prince Edward Island who is fellowship-trained in nuclear medicine(Grant McKenna, Health PEI, Queen Elizabeth Hospital, PE: personal communication, October 20, 2020).
c There is one imaging medical physicist practising in Prince Edward Island who is certified in mammography (Grant McKenna, Health PEI, Queen Elizabeth Hospital, PE: personal communication, October 20, 2020).
Scope of Medical Radiation Technologist Practice
Canada’s 25,033 MRTs made up the bulk of the medical imaging workforce in 2018. There are four different subspecialties of MRTs, including magnetic resonance technologists, nuclear medicine technologists, radiation therapists, and radiological technologists.32,33
MRTs produce high-quality diagnostic images or carry out diagnostic procedures using ionizing radiation. They use their scientific knowledge, technical competence, and patient interaction skills to provide safe and accurate imaging procedures.34 The scope of practice of MRTs includes the following:32-34
- delivering high-quality care to ensure optimal patient outcomes through the acquisition of images or the planning and delivery of ionizing radiation for therapeutic purposes
- collaborating with other health care professionals to optimize patient diagnostic and treatment services through gathering information to plan for the exam or treatment, adapting protocols to accommodate patient needs, and ensuring optimal patient positioning
- applying knowledge of radiation protection and safety for patients, families, and other health care colleagues and providers by applying principles of “as low as reasonably achievable” (ALARA)
- evaluating images for technical quality and determining whether additional images will be necessary
- identifying, preparing, and/or administering prescribed pharmaceuticals under the supervision of a physician
- monitoring patient status and responding to any change in condition
- demonstrating ongoing commitment to education and training
- practising in accordance with a code of ethics, scope and standards of practice, and regulatory requirements.
Scope of Radiologist Practice
Canada’s 2,582 radiologists are physicians who specialize in the field of medical imaging to diagnose and treat illness.28 Radiologists interpret imaging procedures, including MRI, CT, nuclear medicine, ultrasonography, and conventional X-ray radiography. They monitor patient treatment and screen for conditions, including cancer and heart disease, and other conditions.28 While their scope of practice varies depending on their provincial regulatory bodies or authorities, their main duties may include:28,35,36
- directing patient care, performing or reviewing medical histories, prescribing and administering medications, or ordering diagnostic tests
- supervising technologists performing imaging exams
- analyzing medical imaging to find abnormalities
- prioritizing requests for investigation and liaising with referring physicians
- establishing radiation safety protocols for patients and staff
- recommending further appropriate examinations or treatments when necessary and conferring with referring physicians
- correlating medical image findings with other examinations and tests
- demonstrating ongoing commitment to education and training.
Scope of Nuclear Medicine Specialist Practice
Canada’s 271 nuclear medicine specialists are physicians who use their knowledge of radiation biology, radiopharmacy, and nuclear physics to diagnose and treat a broad spectrum of conditions in patients.29 The main imaging modalities used by these specialists include planar imaging, SPECT, SPECT-CT, PET-CT, and PET-MRI.
Nuclear medicine specialists use their medical knowledge to:29,37
- advise physicians on the appropriate nuclear medicine diagnostic exam to address the clinical problem
- perform clinical assessment of patients, correlate the results with other clinical investigation, and select the optimal procedural protocol
- supervise technologists performing nuclear medicine exams, interpret results, and provide a timely report
- contribute their expertise on patient care during interprofessional rounds
- advise on the therapeutic use of nuclear medicine by assessing patients, developing treatment plans, administering treatment, and assessing treatment safety and efficacy
- provide emergency medicine to patients related to nuclear medicine diagnosis or treatment
- manage the activities and oversee the workflow of nuclear medicine departments
- prioritize requests for investigation and liaise with referring physicians
- support the work of technologists and assist in their professional development
- establish radiation safety protocols for patients, staff, and for isotope generation, storage, dosage, use, and disposal
- advise facilities on the purchase of new equipment and isotopes and develop new protocols for diagnosis and treatment
- identify, prepare, and/or administer prescribed pharmaceuticals
- demonstrate ongoing commitment to education and training.
Scope of Imaging Medical Physicist Practice
There are three certifications for Imaging Medical Physicists in Canada: diagnostic radiological physics (X-ray), MRI, and nuclear medicine physics. Canada’s 24 certified imaging medical physicists specialize in optimizing the use and functionality of medical imaging equipment. They work with conventional X-ray radiography, fluoroscopy, mammography, CT, MRI, nuclear medicine, and ultrasonography.31 Most certified imaging medical physicists work in hospital imaging departments. Their main responsibilities include:
- accreditation of imaging equipment
- equipment selection and purchasing
- acceptance testing to ensure that equipment specifications are met and equipment is safe to use
- periodic performance audits of imaging equipment
- equipment safety testing for estimates of doses received by patients and staff and radiation protection.
Overall Findings
Type of Facility
Most sites that responded were publicly funded hospitals, community hospitals, or tertiary care centres in urban areas. The number of sites identified as free-standing clinics varied across provinces, depending on policy and funding within the provinces. Some provinces use referral to free-standing clinic, possibly to manage workload or wait times. Responding sites were predominantly urban, with just more than a quarter of the sites being rural, and a small number being remote. The setting data are incomplete, as sites that could be identified as remote by location or other means did not respond to that particular survey question. Some rural sites are served by mobile units (particularly CT or MRI) shared among several sites.
Modalities and Number of Units
Of the modalities surveyed, CT is the most widely distributed, with the highest number of units and highest volume of use overall (based on the number of exams and hours of use), followed by MRI. All provinces and territories have at least one CT unit; all provinces and Yukon have at least one MRI unit; and all provinces have at least one SPECT and/or SPECT-CT unit. None of the territories have SPECT or SPECT-CT. Nine provinces have PET-CT in clinical use. Two provinces, Alberta and Ontario, have PET-MRI that is used for research purposes.
Variation in Number of Exams
For this iteration of the CMII, we reported validator data at the provincial level and supplemented this with data collected from private facilities. We also collected site-level data on the volume of exams, but not all sites reported or updated exam counts. In some instances, there was a considerable difference between data on the volume of exams collected through the survey and supplied by the validators. This may be due to a number of factors. For some facilities, counts were rounded to the nearest hundred or thousand. Some facilities provide both publicly funded and private imaging services paid for by private health insurance or out-of-pocket patient payments and therefore were not entirely covered by validator counts, which capture only public payments.
Variation in Type of Use Across Modalities
Data on the use of imaging modalities were collected in three broad areas, including data on the overall distribution of use for cardiac, noncardiac, and research purposes; clinical distribution of overall time for diagnostic, interventional, and research purposes; and more detailed data on distribution of use by clinical discipline. All modalities were used predominantly for noncardiac purposes, although SPECT and SPECT-CT have higher use for cardiac purposes. Among disciplines, oncology, musculoskeletal imaging, and neurology form the major uses for all modalities, with the exception of PET-CT, which is mainly used for oncology imaging, with a small proportion used for neurology and cardiac imaging. PET-MRI is at present used for research purposes only.
We focused on reporting imaging for clinical purposes in our selection of survey contacts, so imaging for research purposes may be under-reported. In large centres, research facilities for medical imaging may be separate from clinical (diagnostic or interventional) imaging, and the survey and validation may not have captured all units primarily used for research within research facilities. Other uses may have been captured but not identified under the “other” category, such as animal research studies or veterinary imaging, although the percentage under the “other” category was very small.
Age of Diagnostic Imaging Equipment
Trends over time show a progressive aging of imaging equipment in Canada (Figure 25). Data are available for CT and MRI throughout the period of the inventory (2001 through 2020). PET and PET-CT were reported separately until the survey of 2012 and combined for the survey of 2015 and after. As of 2019–2020, PET units have largely been replaced by PET-CT units. A similar, although slower, replacement appears to be involve the replacement of SPECT by SPECT-CT. In the earlier iterations of the survey, SPECT units were reported in combination with planar cameras under the category “nuclear medicine,” and data on SPECT-CT were collected only for the later years of the inventory.
Figure 25: Aging and Succession of Imaging Equipment Over Time, 2001 to 2020
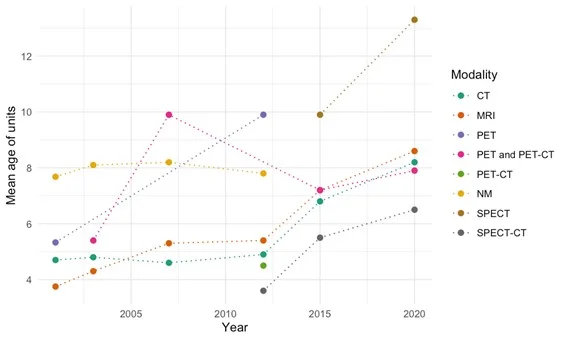
CT = computed tomography; MRI = magnetic resonance imaging; NM = nuclear medicine; PACS = picture archiving and communication system; PET = positron emission tomography; PET-CT = positron emission tomography–computed tomography; PET-MRI = positron emission tomography–magnetic resonance imaging; SPECT = single-photon emission computed tomography; SPECT-CT = single-photon emission computed tomography–computed tomography.
Source: CIHI (2007),19 CIHI (2012),38 CADTH (2015),20 CADTH (2017),21 CADTH (2020).
For all modalities, the mean age of equipment has risen over time. In 2001, the mean age for a CT unit was 4.7 years;39 in 2012, 4.9 years,38 and in 2020, 8.2 years. In 2001, the mean age of an MRI unit was 3.8 years,40 in 2012, 5.4 years,38 and in 2020, 8.6 years. The mean age of the pooled categories PET and PET-CT rises throughout, from 5.4 years in 200338 to 7.9 years in 2020. In earlier iterations of the survey, SPECT units were reported along with planar units. In 2012, SPECT was first reported separately; that year, the mean age of SPECT units was 9.9 years,38 and, in 2020, 13.3 years. The average age of SPECT-CT units in 2012 was 3.6 years,38 in 2020, 6.5 years.
In the 2017 report, the findings for age of equipment were compared with guidelines for the age of imaging equipment published by the CAR41 and the European Coordination Committee of the Radiological, Electromedical and Healthcare IT Industry (COCIR).42
The CAR guidelines41 proposed life expectancies for imaging equipment according to use, classified as either high, medium, or low, based on the number of examinations per year. For the five modalities with age information available (CT, MRI, PET-CT, SPECT, and SPECT-CT) the CAR guidelines proposed life expectancies of eight, 10, and 12 years for high-, medium-, and low-usage machines, respectively. In the 2017 CMII survey, 25.7% of CT units, 30.0% of MRI units, 15.8% of PET-CT units, 57.5% of SPECT units, and 12.4% of SPECT-CTs were older than 10 years (the medium-use category). The corresponding figures for 2020 are 32.4% of CT units, 36.1% of MRI units, 35.7% of PET-CT units, 69.4% of SPECT units, and 25.2% of SPECT-CT units.
The CAR guidelines also recommended that the maximum life expectancy and clinical relevance for any imaging equipment should not be expected to exceed 15 years.41 As of 2017, 2.4% of CT units, 3.5% of MRI units, zero PET-CT units, and 0.5% SPECT-CT units were older than 15 years, and a substantial percentage (21.4%) of SPECT units are beyond the CAR’s recommended life expectancy. The corresponding figures for 2020 for units older than 15 years are 5.2% of CT units, 9.9% of MRI units, 1.8% of PET-CT units (representing one unit), 34.6% of SPECT units, and 1.1% of SPECT-CT units.
The COCIR guidelines42 defined three “golden rules” for evaluating medical equipment age and aid procurement decisions, balancing keeping equipment current with the need to maintain an efficient health care system:
- At least 60% of imaging equipment should be five years old or less. Only the newest modality, MRI, meets this criterion as of 2020, with 33.6% of CT units, 30% of MRI units, 23.2% of PET-CT units, two of three PET-MRI units (66.7%), 10.1% of SPECT units, and 45% of SPECT-CT units being five years of age or newer.
- No more than 30% of imaging equipment should be between six and 10 years old. Unlike in 2017, most modalities meet this criterion, with 22.8% of CT units, 26.7% of MRI units, 28.6% of PET-CT units, 17.2% of SPECT units, and 25.5% of SPECT-CT units being between six and 10 years old. This, however, is because the aging of units has increased the representation of those 10 years or older.
- No more than 10% of imaging equipment should be older than 10 years. None of the modalities meet this criterion, with the exception of PET-MRI, as described in the paragraphs under the CAR guidelines.
The CAR is a professional medical association with industry partnerships based in Canada, so its recommendations are more cognizant of Canadian practice and the health care landscape. The COCIR is a European-based organization representing the manufacturers of diagnostic imaging equipment and therefore may be less relevant to the Canadian context as well as reflecting industry priorities. Overall, imaging equipment in Canada appears to trend older than the recommended profile. As the CAR guidelines indicate, lifetime depends on extent of use; because CMII requested average exams at a site, we cannot at present stratify age by use. In addition, the number of exams is unavailable for many sites, with the validated totals reported at the province level.
PACS Accessibility
Adoption of PACS in Canada has been extensive. Most facilities contacted for this survey reported using PACS, with 48% of access provided provincially and the rest evenly split between local and regional access. Most sites that store images for a given modality (e.g., CT) also have units of that modality. A minority of sites that do not have a given modality (e.g., PET-CT), may have access via PACS to images obtained at a different site or sites that are on the same network.
Sites with PACS that are geographically close together are not necessarily able to share images, if they are on separate networks with different protocols. This could affect sites close to provincial boundaries or sites in the same province but on different regional networks or systems. Several respondents provided comments suggesting this was the case; however, they also described plans to extend PACS coverage within their jurisdictions. The inability to share images easily with PACS may delay patient care, adversely effect patient outcomes, and impact radiologist workflow and efficiency. Challenges to integrating multiple PACS units both within and between hospitals, and with other hospital systems, are well reported. These issues demonstrate that the use of PACS is not necessarily an indicator of how accessible images are across different hospitals, which has prompted improvements in PACS functionality.43
Discussion
These results are based on responses from a pan-Canadian survey of health care facilities, combined with historical data from previous surveys and data from provincial validators. As well, data from other health-related sources have been incorporated into the discussion.
Jurisdictional Differences
Influence of Geography
The survey was restricted to the six advanced medical imaging modalities identified by experts as of the most interest, and these modalities are concentrated in major urban centres and in provinces and territories with larger populations. The larger provinces — Alberta, British Columbia, Ontario, and Quebec — have the greatest variety of modalities and number of individual units. Jurisdictions with the fewest units include the territories and Prince Edward Island.
The number of units per million people is more consistent across provinces than the total unit counts per population, but this measure does not account for population distribution in the respective provinces or territories. As an example of the geographic challenges, the Northwest Territories and Nunavut each have a single CT unit serving the entire region (22.3 and 25.7 units per million population, respectively). Quebec, a province of comparable area, has 164 units (19.2 units per million population), predominantly in the south of the province where the population is concentrated.
Some of the smaller and less populated provinces or territories lack within-jurisdiction access to most modalities, and access may depend on cross-jurisdictional partnerships, patients’ abilities and willingness to travel, and integrated telemedicine services.
Private Imaging Clinics
Our survey indicates that private clinics operate in many provinces in Canada. Within their respective regulatory frameworks, these clinics are permitted to provide either publicly funded exams, privately funded exams, or a combination of both. Privately operated MRI services are available in seven provinces (British Columbia, Alberta, Saskatchewan, Ontario, Quebec, New Brunswick, and Nova Scotia.) Privately operated CT services are available in five provinces (British Columbia, Alberta, Saskatchewan, Ontario, and Quebec). For nuclear medicine, PET-CT is offered in the private setting in three provinces (British Columbia, Ontario, and Quebec) and in some instances is funded publicly, and SPECT and SPECT-CT are offered in two provinces (Alberta and Ontario).
Private imaging services can be paid for through supplementary health insurance, employer health spending accounts, or out-of-pocket.44 According to our data, the estimated operating revenue sourced from out-of-pocket patient payments or private insurance in private clinics is approximately 50%.
Funding Structures
There are differences in funding structures across jurisdictions; specifically, some allow private-public partnerships,45,46 which usually take the form of privately funded imaging facilities conducting publicly funded exams. As well, regulatory frameworks that govern the operation of private facilities may differ across jurisdictions47,48 and influence the type of imaging modality that can operate and the number and use of private clinics. Overall, there is a low volume of publicly funded exams conducted in private settings across Canada. Three provinces (Alberta, Saskatchewan, and Ontario) conduct a limited volume of publicly funded MRI exams in private clinics, and two provinces (Saskatchewan and Ontario) provide a limited volume of publicly funded CT exams in private clinics.
Funding for Imaging Equipment
Provincial and territorial validators were asked to report the sources of funding for imaging equipment. Eleven jurisdictions reported receiving 90% or more of their funding from provincial or regional public health sources. Two provinces reported receiving most of their funding from charitable donations. In retrospect, we realized that it may have been more meaningful if we had asked validators to report separately on the sources of funding for the purchase, installation, and replacement of equipment costs (capital costs) and the day-to-day costs (operational costs) of equipment.49 It remains unclear whether the validators may have answered the question differently if those distinctions had been made. As well, definitions of capital and operational costs may vary across Canada.
In some provinces, hospitals are either exclusively or partially responsible for the purchase of new equipment through capital budgets. Capital purchases may require final health ministry or health authority approval for large-ticket items, but, unlike operational budgets, hospitals control their own capital budgets.50 The sources of hospital capital budgets often include corporate gifts; foundation or individual philanthropic donations; debt incurred through loans and bonds; social impact bonds and grants; government funds; and fees from parking and renting space for events.51,52
Philanthropic funding may contribute a large component of capital budgets.52 It often tends to be unevenly distributed among hospitals, depending on their size and location, and the other capital funding sources are sensitive to fluctuations in the economy.51 In some jurisdictions, hospitals in small and relatively poor communities that need new imaging equipment are required to provide the same amount of funding as those in larger, wealthier regions.52 For rural hospitals that provide specialized regional services for large catchment areas, such as imaging for stroke patients, raising funds for much-needed imaging equipment may be challenging.52 The size of their patient population and their reliance on expensive imaging equipment may be more substantial than those of larger urban hospitals, yet these variables may not be reflected in their capital budgets. As well, hospitals in rural setting may not have access to the same level of fundraising expertise as hospitals in urban settings, and the threshold for donor fatigue may be lower.52
Urgent competing issues, shifts in community priorities, a shrinking donor pool, and skepticism among donors concerning how efficiently their charitable contributions are being used53 raise questions concerning the reliance on donations as a means of securing critical health care equipment, including imaging equipment. It also raises questions concerning whether funding imaging equipment from capital budgets, especially those that rely heavily on charitable donations, may undermine the concept of equity in health care.54
Trained Personnel
The availability of trained personnel to conduct, read, and interpret imaging exams may also contribute to some of the variation observed across sites in terms of the types of imaging modalities available, and the volume and type of exams conducted. Centres that provide employment prospects and opportunities to participate in cutting-edge technology innovation, such as academic training hospitals, research facilities, and large health care facilities, may be necessary to attract clinicians, technologists, technicians, and other support staff (e.g., radiation safety specialists and nuclear medicine physicists). Remote or rural centres may face challenges in attracting and retaining highly trained professionals, or in providing training and continuing education for existing staff.55
Impact of Availability on Wait Times
Wait times for medical imaging are an ongoing concern in Canada.15 While provincial strategies are in place to reduce wait times for these services, Canadian patients are still waiting beyond targeted wait times.56,57 Overall, wait times have increased for CT and MRI (the only modalities for which wait times are recorded and that are relevant to this report) over the last five years. The COVID-19 epidemic has only exacerbated the problem (see COVID-19 Impact on Wait Times). CAR recommends maximum MRI and CT wait time targets of 24 hours for emergency/life-threatening conditions, seven days for urgent conditions, 30 days for semi-urgent conditions, and 60 days for non-urgent conditions.15 Median wait times for medically necessary elective MRI exams are longer (9.3 weeks) than for CT (4.8 weeks), and there is variation across jurisdictions, with half of patients receiving an MRI exam within 42 to 126 days and a CT exam within 18 to 49 days.49,56 According to the Conference Board of Canada, wait times for radiology services such as CT and MRI exams, cost the Canadian economy $3.54 billion in lost productivity each year.15 While wait times have increased, so have the number of exams performed by radiology professionals, with a 31% increase in CT exams and a 62% increase in MRI exams over the last decade. Our findings indicate that imaging machines are used for an average of 8.5 to 14.1 hours per day for CT and 7.5 to 16.5 hours per day for MRI, suggesting there is capacity to do more exams on existing equipment, rather than investing in new equipment, of which the latter is a common strategy used to reduce wait times.57 This will not, however, improve access in regions where there is no existing imaging equipment, or address restrictions due to lack of funding or availability of radiologists, technicians, and support staff.
COVID-19 Impact on Wait Times
Wait times are expected to further increase with the COVID-19 pandemic. During this public health crisis, Canadian governments issued emergency orders closing all nonessential services, including medical imaging services, in an effort to prevent the spread of infection.16 As a result, the pandemic has contributed to the ongoing wait list challenges experienced by Canadians requiring medical imaging services. Capacity for medical imaging services was reduced significantly, approximately by 50% to 70% between March and April 2020.16 Airborne decontamination processes were introduced to radiology suites to mitigate the spread of COVID-19. The length of time to complete this process after each exam further limits the volume that can be conducted.16 Reopened imaging departments are managing the significant backlog of postponed and rescheduled exams, as well as the reduced volume due to safety precautions.16
The use of CT may be affected by the backlog and safety measures compared to other advanced imaging modalities because it is used in some instances to diagnose COVID-19.58 While CT is not recommended for routine screening or diagnosis, due to cost, pandemic-driven resource constraint, and risk of infection spread, it does play a role in expediting care in patients with suspicious clinical presentation with a negative or pending swab test, with deteriorating respiratory status, or developing complications.58
Changes in Units and Exams Since the 2017 CMII Report
Between 201721 and 2019–2020, the number of CT and SPECT units decreased by 2.1% and 7.6%, respectively, for Canada as a whole. The number of units of the other four modalities increased, by 3.3% for MRI, 11.8% for PET-CT, 33.3% for PET-MRI, and 3.8% for SPECT-CT. The decrease in CT units is primarily due to a decrease of 11.7% in unit counts in Ontario, from 184 units to 169 units. The decrease in CT units may be explained by decommissioning units at the end of their operational life. The majority of provinces had a decrease in SPECT numbers, although both New Brunswick and Newfoundland and Labrador had a large percentage increase, based on additions to small unit counts. SPECT and SPECT-CT accounting has been variable. There are two possible reasons for this: (1) sites' and validators' uncertain identification of units with low CT resolution as SPECT rather than as SPECT-CT and (2) the tendency for some jurisdictions to report combined counts, leading us to estimate how many are SPECT and how many SPECT-CT. For modalities that saw an increase in units, nationally, the additional units were distributed across provinces.
Figure 26 shows the percentage change in units per million population between 201721 and 2019–2020. The decrease in CT units per million population is 5.4%, and that for SPECT is 10.2%. The increases for MRI, PET-CT, and SPECT-CT per million population are 0%, 7.9%, and 1.0%, respectively. In most provinces, the number of CT units and SPECT-CT units per population decreased, indicating that population growth outstripped installation. Provincial results for MRI, PET-CT, and SPECT were variable.
Figure 26: Percentage Change in Units per Million Population for Imaging Modalities, 2017 to 2019–2020
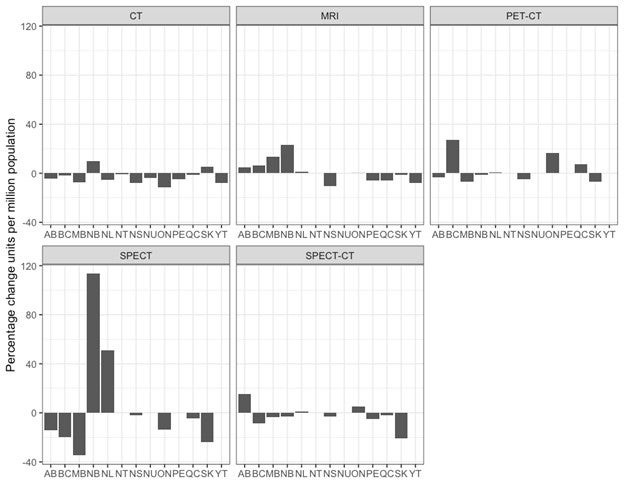
AB = Alberta; BC = British Columbia; CT = computed tomography; MB = Manitoba; MRI = magnetic resonance imaging; NB = New Brunswick; NL = Newfoundland and Labrador; NS = Nova Scotia; NT = Northwest Territories, NU = Nunavut; ON = Ontario; PE = Prince Edward Island; PET-CT = positron emission tomography–computed tomography; QC = Quebec; SK = Saskatchewan; SPECT = single-photon emission computed tomography; SPECT-CT = single-photon emission computed tomography–computed tomography; YT = Yukon.
Source: CADTH (2017);21 CADTH (2020).
Between 201721 and 2019–2020, the number of CT exams increased by 10.7%. (The number of exams reported for CT in 2017 in this report differs slightly from that reported in the 2017 CMII report; further details are provided in Appendix 4.) All provinces and territories reported an increase in exams, with the exception of Saskatchewan (2.7% decrease). The number of MRI exams increased by 25.6% for Canada, with an 83.6% increase in Saskatchewan. PET-CT exams increased by 44.1%, with the greatest increase for a province that had a PET-CT in operation in 2017 of 114.3% in Ontario (Newfoundland and Labrador posted PET-CT exams for the first time in 2019–2020). Multiple jurisdictions reported combined SPECT and SPECT-CT exams, which declined by 8.1%, decreasing in all provinces except Alberta and Manitoba.
Figure 27 shows the percentage change in exams per thousand population. The increase in CT exams per thousand population is 7.4%, while the increases for MRI and PET-CT are 21.0%, and 75.0%, respectively. The decrease for combined SPECT and SPECT-CT is 11.1%.
Figure 27: Percentage Change in Exams per Thousand Population for Imaging Modalities, 2017 to 2019–2020
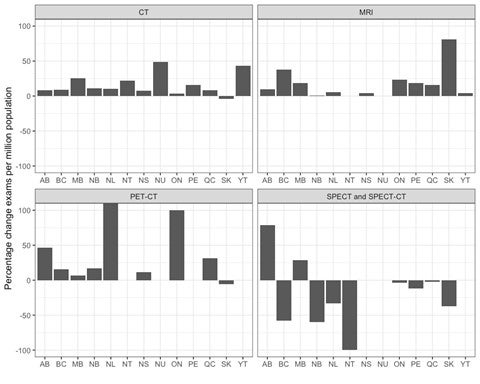
AB = Alberta; BC = British Columbia; CT = computed tomography; MB = Manitoba; MRI = magnetic resonance imaging; NB = New Brunswick; NL = Newfoundland and Labrador; NS = Nova Scotia; NT = Northwest Territories, NU = Nunavut; ON = Ontario; PE = Prince Edward Island; PET-CT = positron emission tomography–computed tomography; QC = Quebec; SK = Saskatchewan; SPECT = single-photon emission computed tomography; SPECT-CT = single-photon emission computed tomography–computed tomography; YT = Yukon.
Source: CADTH 2017;21 CADTH 2020.
Trends Over Time
Overall Summary
Each imaging modality, apart from SPECT, experienced growth in the last decade in Canada in terms of both the number of units and the number of units per million people. However, there were disparities between jurisdictions in terms of growth per unit and variances between different modality types for the number of units per million people (Figure 28). The data for this comparison are drawn from this report for 2019–2020 and from CIHI’s QuickStats tool.18
The most widely available imaging modality in Canada, of the six this survey looked at, is CT. It is also the only imaging modality available in all provinces and territories. Over the last decade, CT experienced the slowest growth rate of all imaging modalities, at 1.4% increase in units per million people over the last decade, compared with other imaging modalities (MRI 20%; PET-CT 25%; and SPECT-CT 70%). The slower growth of CT units compared to other modalities may be influenced by several factors:
- The majority of sites that would be expected to have a CT in Canada already have at least one unit.
- Replacing older with newer CT equipment provides faster imaging speeds, which may increase exam throughput.
- Decommissioned units are now better identified in the survey, which has reduced counts.
The hybrid modality SPECT-CT has experienced the most rapid growth in overall units, followed by PET-CT and MRI.
In 2010, SPECT was the most popular advanced imaging modality. The combination of SPECT and gamma cameras totalled 618 units in 10 jurisdictions.18 In 2019–2020 , the number of SPECT units declined to 305 in nine jurisdictions. This decline of 51% may be connected to the rapid adoption of SPECT-CT. PET-MRI is still an emerging technology, with five units used for research purposes in two provinces.
Figure 28: Changes in Units per Million Population Between 2010 and 2019–2020 for CT, MRI, PET-CT, SPECT, and SPECT-CT
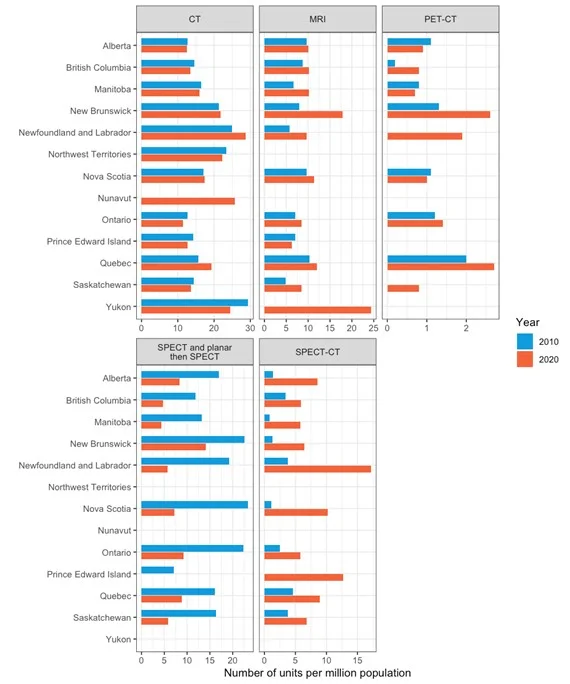
CT = computed tomography; MRI = magnetic resonance imaging; PET-CT = positron emission tomography–computed tomography; SPECT = single-photon emission computed tomography; SPECT-CT = single-photon emission computed tomography–computed tomography.
Source: CIHI (2012); 38 CADTH (2020).
Examination data for 2010 were reported only for CT and MRI (Figure 29). The overall volume of exams increased by 32% and 62% for the two modalities, respectively. Similarly, the number of exams per thousand population increased by 18% and 46%, respectively.
Figure 29: Changes in Exams per Thousand Population Between 2010 and 2019–2020 for CT and MRI
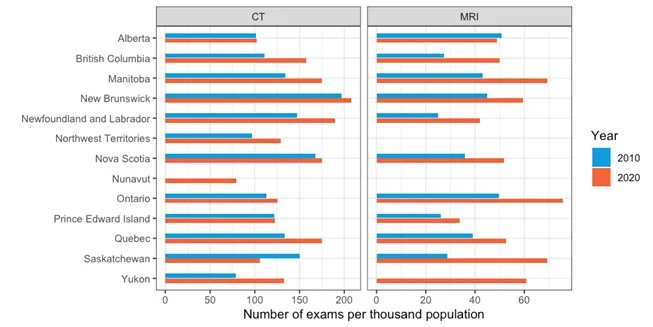
CT = computed tomography; MRI = magnetic resonance imaging.
Source: CIHI (2012) 38; CADTH (2020).
Computed Tomography
CT is the only imaging modality reviewed in this report that is available in every jurisdiction (province or territory). There were 484 CT units in Canada in 2010,18 compared with 549 in 2019–2020, representing a 13% increase over the 10-year period in terms of overall units. There was at least one CT unit, to a maximum of 169 CT units, per jurisdiction in 2019–2020, compared with 10 years ago, when 12 jurisdictions had between one and 165 CT units each. For both 201018 and 2019–2020, approximately 60% of all CT units were located in the two most densely populated provinces, Ontario and Quebec.
Over the last 10 years, growth in CT units outstripped population growth by 1.4%, with the greatest increase in Newfoundland and Labrador (25.0 units per million18 to 28.7 units per million) and Quebec (15.6 units per million18 to 19.2 units per million). CT units per million people decreased for eight jurisdictions. For all of Canada, CT units per million people expanded from 14.3 per million people in 201018 to 14.5 per million people in 2020.
In terms of volume of exams, there were 4,122,158 CT exams conducted in Canada in 2010,18 compared with 5,419,821 in 2019–2020, representing a 31% increase over a decade. Four jurisdictions (British Columbia, Manitoba, Quebec, and Yukon) experienced a growth rate of between 42% and 103% in the volume of exams, and one jurisdiction experienced a decline in exam volume. Nationwide, the overall volume of CT examinations per thousand population increased from 121.9 to 143.3, representing a 17% increase over the last 10 years.
Magnetic Resonance Imaging
MRI is the second most commonly available imaging modality reviewed in this report. There were 281 MRI units in 10 jurisdictions in 2010,18 compared with 378 in 11 jurisdictions in 2019–2020, representing a 35% increase over the last 10 years. Some of the growth in units in some provinces may be from the private sector. The two jurisdictions with no existing MRI capacity also have the lowest populations in Canada. Approximately 60% of all MRI units are located in Ontario and Quebec, and this was the same in 2010.
The number of MRI units per million people increased for all jurisdictions with existing MRI capacity over the last 10 years, with the exception of one jurisdiction. The jurisdictions with the greatest growth in MRI units per million were Manitoba, New Brunswick, and Newfoundland and Labrador. For all of Canada, MRI units increased from 8.3 per million people in 201018 to 10.0 MRIs per million people in 2019–2020, representing a 20% growth rate.
In 2019–2020, the volume of MRI exams conducted in Canada was higher in all jurisdictions than in 2010,18 with 2,330,223 and 1,434,499 exams conducted, respectively, representing a 62% increase over a decade. In 2010,18 Ontario accounted for 45% of all MRI exams, compared with 48% of all MRI exams in 2019–2020. For Canada as a whole, the rate of MRI examinations per thousand population rose from 42.4 in 2010 to 61.6 in 2019–2020, an increase of 45%.
Positron Emission Tomography and Positron Emission Tomography–Computed Tomography
There were 40 PET or PET-CT units in Canada in 2010,18 compared with 57 in 2019–2020, representing a 43% increase over the last 10 years. There are PET-CT units in nine jurisdictions in 2019–2020, compared with seven jurisdictions 10 years ago.18 The jurisdictions with no PET-CT are those with the smallest populations. About 80% of all PET-CT units were in Ontario and Quebec in 2010,18 compared to 75% in 2019–2020.
At the national level, PET-CT units increased from 1.2 per million people in 201018 to 1.5 per million people in 2019–2020, representing a 25% increase over the time period. Seven jurisdictions experienced a slight growth in the number of PET-CT units per million people over the last 10 years. Three jurisdictions experienced a slight decline in units per million population.
Single-Photon Emission Computed Tomography
SPECT is the only imaging modality reviewed in this report that decreased in number of units over the last 10 years. In 2010,18 SPECT was the most commonly available imaging modality in Canada, with a combined count of gamma and SPECT cameras of 618 units in 10 jurisdictions.18 Ten years later, there were 305 SPECT units in nine jurisdictions, representing an overall decline of 50%. The number of SPECT units may be lower than reported because some jurisdictions include planar imaging in this count.
For all of Canada, SPECT declined from 18.3 (combined count) units per million people in 201018 to 8.1 units per million people in 2019–2020. The decline is SPECT may be attributed to its gradual replacement by SPECT-CT. In 2010, Ontario and Quebec accounted for 68% of all SPECT, compared with 75% in 2019–2020.
Single-Photon Emission Computed Tomography–Computed Tomography
SPECT-CT is unique among the imaging modalities reviewed in this report, in that it experienced significant, rapid growth over the last 10 years compared with the other modalities. In 2010,18 there were 98 SPECT-CT units in nine jurisdictions,18 compared with 271 SPECT-CT units in 10 jurisdictions in 2019–2020, representing an increase of 177% over the last decade. Since Quebec combines its inventory of SPECT and SPECT-CT units, a 50:50 split was assumed. Ontario and Quebec account for 59% of all SPECT-CT in 2020,18 compared with 71% in 2010.
Trends in Technical Specifications Over Time
Data for trends in technical specifications over time are drawn from the CCOHTA (2001) report,59 the CIHI (2007) report,19 the CIHI (2012) report,17 the CIHI QuickStats dataset,18 the CMII (2015) report,20 the CMII (2017) report,21 and this current CMII (2019–2020) report. The 2015 data were subject to additional data-cleaning before being uploaded for the 2017 survey, and this cleaned dataset has been used.
Computed Tomography
Trends Over Time in Number of Slices in CT Units
Table 70 and Figure 30 show the number of slices reported for CTs for 2007 through 2019–2020. Unit-level data were not reported by CCOHTA in 2001 for CT. Missing data are not shown or included in percentage totals, and older units identified in the 2012 dataset as “multislice” are not represented.
The most common numbers of slices overall are 16, 64, and 128. In 2007, the most common number of slices was four slices (26.7% of reported units), followed by the then-maximum, 64 (25.4%). In subsequent years, 64-slice CTs were the best represented, accounting for half of the reported units (48.7% in 2012, 52.1% in 2017, and 46.7% in 2019–2020). There was a steady increase in the percentage of units with 128 slices, from 4.9% in 2012 to 22.8% in 2019–2020. After 2012, there was a stable, small minority of units with 256 and 320 slices.
Table 74: Reported Slices for CT Units, 2007 to 2019–2020
| Slices | 2007 | 2012 | 2015 | 2017 | 2020 |
|---|---|---|---|---|---|
| 1 | 42 (11.2) | 15 (3.3) | 13 (3.2) | 10 (2.2) | 7 (1.6) |
| 2 | 14 (3.7) | 5 (1.1) | 5 (1.2) | 3 (0.6) | 3 (0.7) |
| 4 | 100 (26.7) | 31 (6.9) | 18 (4.4) | 15 (3.2) | 9 (2) |
| 6 | 0 | 3 (0.7) | 3 (0.7) | 1 (0.2) | 1 (0.2) |
| 8 | 19 (5.1) | 17 (3.8) | 14 (3.4) | 11 (2.4) | 6 (1.3) |
| 10 | 5 (1.3) | 3 (0.7) | 3 (0.7) | 1 (0.2) | 1 (0.2) |
| 16 | 91 (24.3) | 105 (23.3) | 92 (22.5) | 85 (18.4) | 61 (13.6) |
| 32 | 4 (1.1) | 4 (0.9) | 2 (0.5) | 2 (0.4) | 6 (1.3) |
| 40 | 4 (1.1) | 6 (1.3) | 5 (1.2) | 3 (0.6) | 1 (0.2) |
| 64 | 95 (25.4) | 219 (48.7) | 206 (50.5) | 241 (52.1) | 209 (46.7) |
| 96 | 0 | 0 | 2 (0.5) | 0 | 0 |
| 128 | 0 | 22 (4.9) | 29 (7.1) | 62 (13.4) | 102 (22.8) |
| 192 | 0 | 0 | 0 | 1 (0.2) | 0 |
| 256 | 0 | 10 (2.2) | 10 (2.5) | 14 (3) | 22 (4.9) |
| 320 | 0 | 10 (2.2) | 6 (1.5) | 14 (3) | 20 (4.5) |
CT = computed tomography.
Figure 30: Trends in Number of Slices of SPECT-CT Units
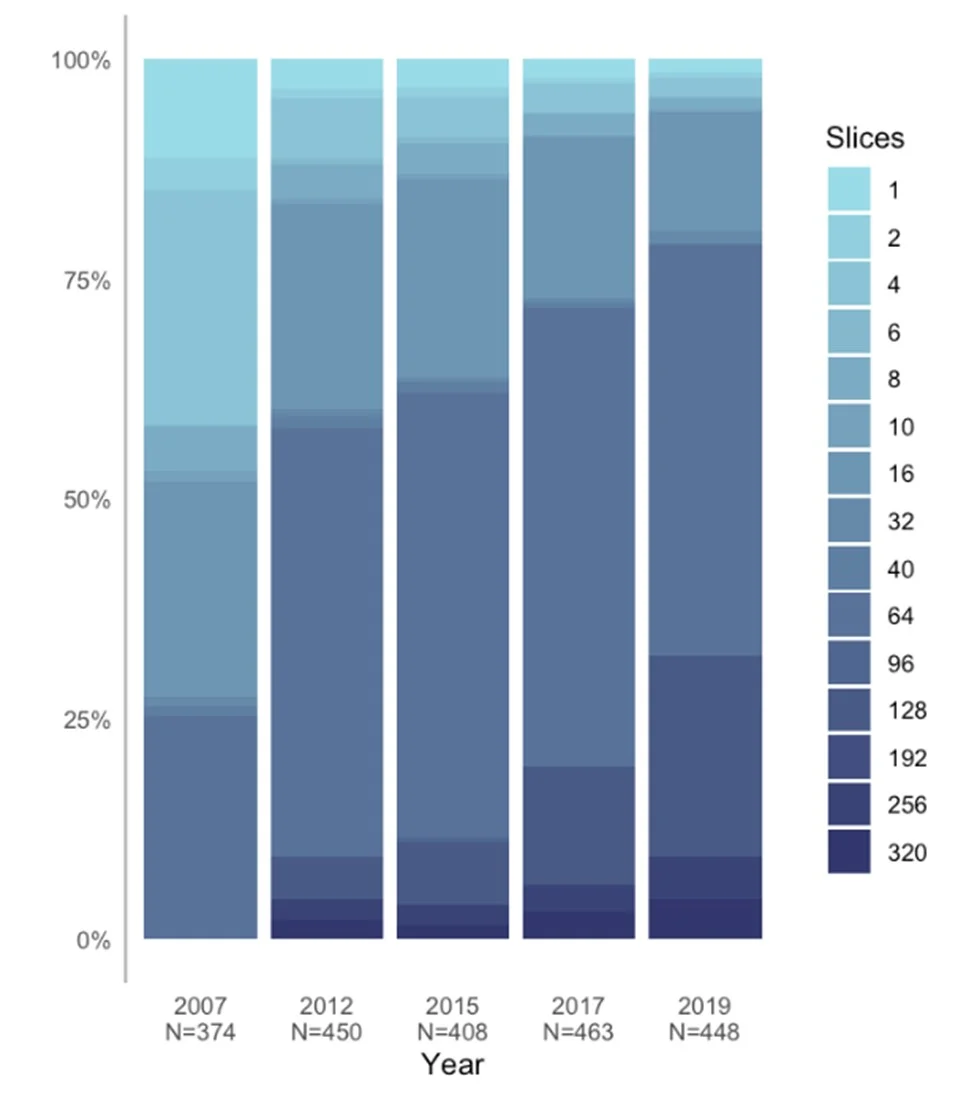
Trends Over Time in Availability and Use of Technologies for Control of Radiation Exposure
Questions regarding technologies for control of radiation exposure were collected for 2015, 2017, and 2019–2020. Missing data are shown and included in percentage totals.
The total number of responses to the questions, and the percentage of “yes” answers to the questions, have increased over time, suggesting increasing adoption of tools for dose management. As of 2020, more than half of the CT units have dose-management controls, image reconstruction, and dose recording. Of those units that have dose-management controls, 82.0% are reported as in use.
Table 75: Availability and Use of Technologies for Control of Radiation Exposure, 2015 to 2019–2020
| 2015 n (%) |
2017 n (%) |
2020 n (%) |
|
|---|---|---|---|
| Does the CT unit have dose-management controls? | |||
| Yes | 36 (8.1) | 199 (33.8) | 294 (52.8) |
| No | 1 (0.2) | 45 (7.7) | 38 (6.8) |
| Don't know | 0 | 9 (1.5) | 19 (3.4) |
| Missing | 405 (91.6) | 335 (57) | 206 (37) |
| If yes, are the dose-management controls used? | |||
| Yes | NR | 157 (78.9) | 241 (82.0) |
| No | NR | 11 (5.5) | 22 (7.5) |
| Don’t know | NR | 2 (1.0) | 12 (4.1) |
| Missing | NR | 29 (14.6) | 19 (6.5) |
| Does the CT unit incorporate image reconstruction techniques for dose reduction? | |||
| Yes | 34 (7.7) | 184 (31.3) | 280 (50.3) |
| No | 3 (0.7) | 54 (9.2) | 45 (8.1) |
| Don't know | 0 | 15 (2.6) | 25 (4.5) |
| Missing | 405 (91.6) | 335 (57) | 207 (37.2) |
| Does the CT unit record patient radiation dose by exam (e.g., as a save screen on PACS)? | |||
| Yes | NR | 185 (31.5) | 292 (52.4) |
| No | NR | 17 (2.9) | 17 (3.1) |
| Don't know | NR | 27 (4.6) | 29 (5.2) |
| Missing | NR | 359 (61.1) | 219 (39.3) |
CT = computed tomography; NR = not reported.
Magnetic Resonance Imaging
Trends Over Time in MRI Field Strength
Table 72 and Figure 31 show the field strength in the reported units for 2001 through 2019–2020. Missing data are not shown or included in percentage totals.
After 2007, more than 80% of units had a field strength of 1.5 T, with a minority of units having 3 T. The latter units increased over time, from 1.1% of units in 2001 to 17.1% in 2019–2020.
Table 76: Reported Field Strengths for MRI units, 2001 to 2019–2020
| Field | 2001 n (%) |
2007 n (%) |
2012 n (%) |
2015 n (%) |
2017 n (%) |
2020 n (%) |
|---|---|---|---|---|---|---|
| 0.2 | 1 (1.1) | 4 (1.8) | 3 (1) | 3 (1) | 0 | 0 |
| 0.23 | 1 (1.1) | 1 (0.5) | 0 | 0 | 0 | 0 |
| 0.3 | 1 (1.1) | 1 (0.5) | 1 (0.3) | 1 (0.3) | 1 (0.3) | 1 (0.3) |
| 0.35 | 0 | 1 (0.5) | 1 (0.3) | 1 (0.3) | 1 (0.3) | 0 |
| 0.4 | 0 | 1 (0.5) | 0 | 0 | 0 | 0 |
| 0.5 | 3 (3.3) | 2 (0.9) | 0 | 0 | 0 | 0 |
| 0.6 | 0 | 0 | 1 (0.3) | 1 (0.3) | 0 | 0 |
| 1 | 19 (20.9) | 17 (7.8) | 9 (3.1) | 8 (2.6) | 4 (1.2) | 2 (0.6) |
| 1.2 | 1 (1.1) | 0 | 0 | 0 | 0 | 0 |
| 1.3 | 0 | 1 (0.5) | 0 | 0 | 0 | 0 |
| 1.5 | 63 (69.2) | 184 (84) | 248 (84.1) | 253 (83.5) | 273 (83.7) | 276 (81.2) |
| 3 | 1 (1.1) | 4 (1.8) | 29 (9.8) | 34 (11.2) | 44 (13.5) | 58 (17.1) |
| 3.5 | 0 | 1 (0.5) | 0 | 0 | 0 | 0 |
| 4 | 1 (1.1) | 1 (0.5) | 1 (0.3) | 1 (0.3) | 1 (0.3) | 1 (0.3) |
| 5 | 0 | 0 | 0 | 0 | 1 (0.3) | 1 (0.3) |
| 9.4 | 0 | 1 (0.5) | 2 (0.7) | 1 (0.3) | 1 (0.3) | 1 (0.3) |
MRI = magnetic resonance imaging.
Figure 31: Reported Field Strengths for MRI Units, 2001 to 2019–2020
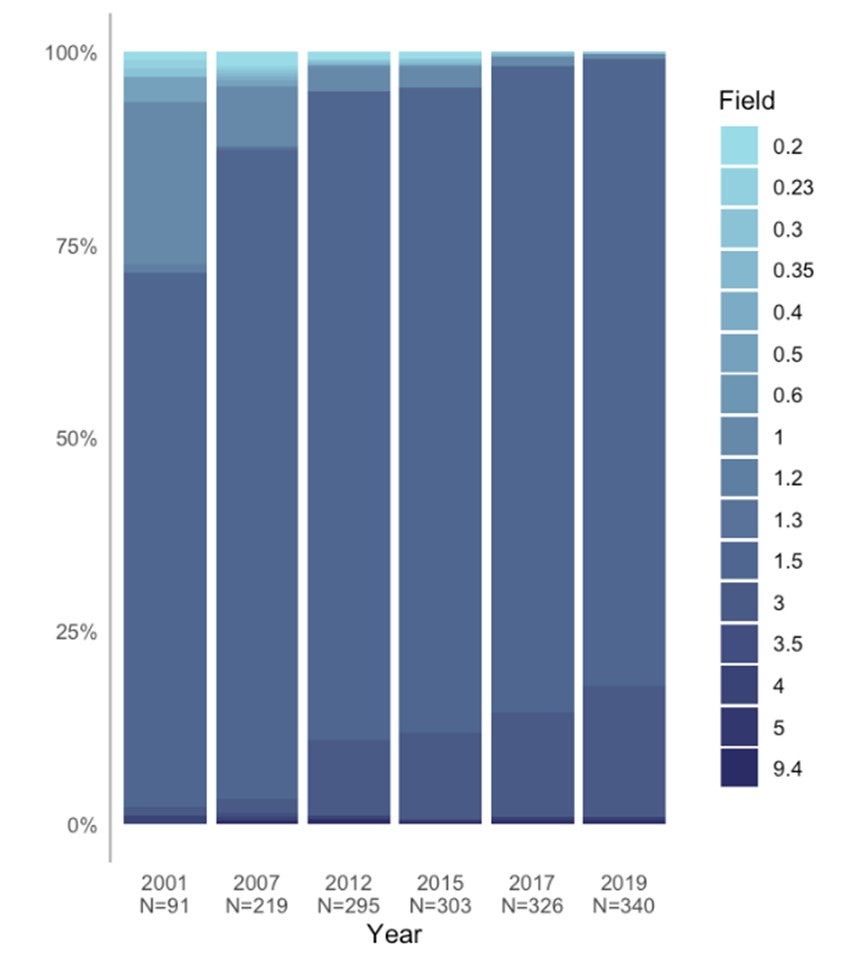
Trends Over Time in MRI Configuration
Information about MRI configuration was not consistently collected over the iterations of the imaging inventory. The CCOHTA (2001) report did not include information about configuration; its technical information concerned the type of magnet, as this was actively changing at the time. The CIHI (2007) report did not include a summary of configuration. In 2012, configuration was reported as three variables, while, in 2015 through 2019–2020, one variable was collected. Remapping of the 2012 data to the single variable was not entirely satisfactory. The data are summarized in Table 73 and Figure 32.
Table 77: Trends Over Time in MRI Configuration
| Config | 2012 n (%) |
2015 n (%) |
2017 n (%) |
2019–2020 n (%) |
|---|---|---|---|---|
| Closed bore – normal | 77 (60.6) | 95 (54.3) | 94 (55) | 132 (55.2) |
| Open bore | 50 (39.4) | 55 (31.4) | 11 (6.4) | 10 (4.2) |
| Closed bore – wide | 0 | 25 (14.3) | 66 (38.6) | 97 (40.6) |
MRI = magnetic resonance imaging.
Figure 32: Trends Over Time in MRI Configuration
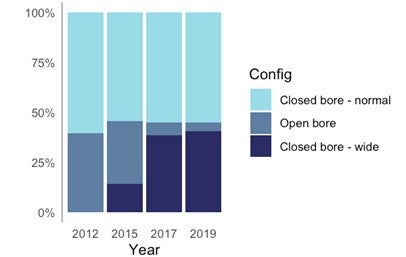
Positron Emission Tomography–Computed Tomography
Trends Over Time in Number of Slices in PET-CT Units
Table 78 and Figure 33 show the number of slices reported from 2012 to 2019–2020. Unit-level data were not reported by CCOHTA in 2001 or by CIHI in 2007. Missing data are not shown or included in percentage totals, and older units identified in the 2012 dataset as “multislice” are not represented.
The most common numbers of slices overall are 16 and 64. There was a steady increase in percentage of units with 64 slices, from 9.4% in 2012 to 28.2% in 2019, and a complementary decrease in percentage of units with 16 slices, from 75.0% in 2012 to 51.3% in 2019–2020.
Table 78: Trends in Number of Slices of PET-CT Units
| Slices | 2012 n (%) |
2015 n (%) |
2017 n (%) |
2019–2020 n (%) |
|---|---|---|---|---|
| 1 | 1 (3.1) | 1 (2.7) | 0 | 0 |
| 2 | 3 (9.4) | 1 (2.7) | 0 | 0 |
| 4 | 0 | 0 | 1 (2.6) | 1 (2.6) |
| 6 | 1 (3.1) | 1 (2.7) | 1 (2.6) | 0 |
| 16 | 24 (75) | 26 (70.3) | 25 (65.8) | 20 (51.3) |
| 32 | 0 | 0 | 0 | 1 (2.6) |
| 40 | 0 | 2 (5.4) | 2 (5.3) | 2 (5.1) |
| 64 | 3 (9.4) | 6 (16.2) | 8 (21.1) | 11 (28.2) |
| 128 | 0 | 0 | 0 | 2 (5.1) |
| 256 | 0 | 0 | 1 (2.6) | 1 (2.6) |
| 320 | 0 | 0 | 0 | 1 (2.6) |
PET-CT = positron emission tomography–computed tomography.
Figure 33: Trends in Number of Slices in PET-CT Units
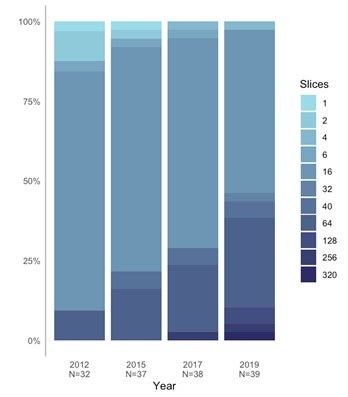
Trends Over Time in Scope of PET-CT Units
Data on scope of imaging was collected for 2015 to 2019–2020. All units that had a reported scope were identified as near-full body/full body, accounting for 20.9% of units in 2015, 42.6% in 2017, and 50.0% in 2019–2020.
Trends Over Time in Availability and Use of Technologies for Control of Radiation Exposure
Table 79 shows availability and use of technologies for control of radiation exposure in PET-CT units from 2015, 2017, and 2019–2020. The data were not collected for the other years.
The total number of responses to the questions, and the percentage of “yes” answers to the questions, have increased over time, suggesting increasing adoption of tools for dose management. As of 2019–2020, more than 40% of units have dose-management controls, image reconstruction, and dose recording. Of those units that have dose-management controls, 37.0% are reported as being in use.
Table 79: Availability and Use of Technologies for Control of Radiation Exposure for PET-CT, 2015 to 2019–2020
| 2015 n (%) |
2017 n (%) |
2019–2020 n (%) |
|
|---|---|---|---|
| Does the PET-CT unit have dose-management controls? | |||
| Yes | 8 (18.6) | 22 (40.7) | 28 (51.9) |
| No | 1 (2.3) | 3 (5.6) | 3 (5.6) |
| Don't know | 0 | 1 (1.9) | 4 (7.4) |
| Missing | 34 (79.1) | 28 (51.9) | 19 (35.2) |
| If yes, are the dose-management controls used? | |||
| Yes | NR | 14 (25.9) | 20 (37) |
| No | NR | 8 (14.8) | 8 (14.8) |
| Don't know | NR | 3 (5.6) | 7 (13) |
| Missing | NR | 29 (53.7) | 19 (35.2) |
| Does the PET-CT unit incorporate image reconstruction techniques for dose reduction? | |||
| Yes | 8 (18.6) | 19 (35.2) | 24 (44.4) |
| No | 2 (4.7) | 2 (3.7) | 4 (7.4) |
| Don't know | 0 | 0 | 1 (1.9) |
| Missing | 33 (76.7) | 33 (61.1) | 25 (46.3) |
| Does the PET-CT unit record patient radiation dose by exam (e.g., as a save screen on PACS)? | |||
| Yes | 8 (18.6) | 18 (33.3) | 26 (48.1) |
| No | 2 (4.7) | 5 (9.3) | 4 (7.4) |
| Don't know | 0 | 3 (5.6) | 5 (9.3) |
| Missing | 33 (76.7) | 28 (51.9) | 19 (35.2) |
PET-CT = positron emission tomography–computed tomography.
Single-Photon Emission Computed Tomography–Computed Tomography
Trends in the Number of Slices of SPECT-CT Units
Table 80 and Figure 34 show the trends in the number of slices in SPECT-CT units in 2012 through 2019–2020. Unit-level data were not reported by CCOHTA in 2001 or by CIHI in 2007. Missing data are not shown or included in percentage totals, and older units identified in the 2012 dataset as “multislice” are not represented.
The most common number of slices overall are four and 26. There was a steady increase in percentage of units with 16 slices, from 6.4% in 2012 to 27.2% in 2020, and a complementary decrease in percentage of units with four slices, from 45.7% in 2012 to 24.6% in 2020.
Table 80: Trends in Number of Slices of SPECT-CT Units
| Slices | 2012 n (%) |
2015 n (%) |
2017 n (%) |
2019–2020 n (%) |
|---|---|---|---|---|
| 1 | 20 (21.3) | 22 (18.2) | 28 (20.6) | 21 (13.5) |
| 2 | 12 (12.8) | 16 (13.2) | 16 (11.8) | 18 (11.5) |
| 4 | 43 (45.7) | 46 (38) | 43 (31.6) | 43 (27.6) |
| 6 | 9 (9.6) | 12 (9.9) | 17 (12.5) | 17 (10.9) |
| 8 | 3 (3.2) | 5 (4.1) | 5 (3.7) | 10 (6.4) |
| 16 | 6 (6.4) | 19 (15.7) | 26 (19.1) | 43 (27.6) |
| 32 | 0 | 0 | 0 | 4 (2.6) |
| 40 | 0 | 0 | 1 (0.7) | 0 |
| 64 | 1 (1.1) | 1 (0.8) | 0 | 0 |
SPECT = single-photon emission computed tomography–computed tomography.
Figure 34: Trends in Number of Slices of SPECT-CT Units
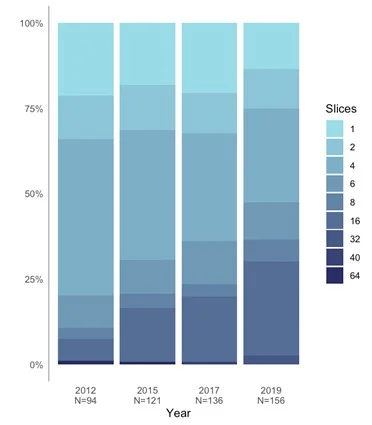
Trends Over Time in Availability and Use of Technologies for Control of Radiation Exposure
Table 77 shows availability and use of technologies for control of radiation exposure in SPECT-CT units from 2015,20 2017,21 and 2019–2020. The data were not collected in other years.
The total number of responses to the questions, and the percentage of “yes” answers to the questions, have increased over time, suggesting increasing adoption of tools for dose management. As of 2019–2020, around 30% of units have dose-management controls, image reconstruction, and dose recording, although this may be an underestimate due to a substantial amount of missing data. Of those units that have dose-management controls, 27.3% are reported as being in use.
Table 81: Availability and Use of Technologies for Control of Radiation Exposure for SPECT-CT, 2015 to 2019–2020
| 2015 n (%) |
2017 n (%) |
2019–2020 n (%) |
|
|---|---|---|---|
| Does the SPECT-CT unit have dose-management controls? | |||
| Yes | 24 (16.1) | 58 (20.5) | 84 (30.5) |
| No | 6 (4) | 34 (12) | 42 (15.3) |
| Don't know | 0 | 11 (3.9) | 22 (8) |
| Missing | 119 (79.9) | 180 (63.6) | 127 (46.2) |
| If yes, are the dose-management controls used? | |||
| Yes | NR | 39 (13.8) | 75 (27.3) |
| No | NR | 7 (2.5) | 7 (2.5) |
| Don't know | NR | 1 (0.4) | 2 (0.7) |
| Missing | NR | 236 (83.4) | 191 (69.5) |
| Does the SPECT-CT unit incorporate image reconstruction techniques for dose reduction? | |||
| Yes | 22 (14.8) | 44 (15.5) | 82 (29.8) |
| No | 8 (5.4) | 35 (12.4) | 31 (11.3) |
| Don't know | 0 | 13 (4.6) | 27 (9.8) |
| Missing | 119 (79.9) | 191 (67.5) | 135 (49.1) |
| Does the SPECT-CT unit record patient radiation dose by exam (e.g., as a save screen on PACS)? | |||
| Yes | 22 (14.8) | 58 (20.5) | 90 (32.7) |
| No | 8 (5.4) | 37 (13.1) | 33 (12) |
| Don't know | 0 | 8 (2.8) | 23 (8.4) |
| Missing | 119 (79.9) | 180 (63.6) | 129 (46.9) |
NR = not reported.
Radiotracer Capacity
There may be concerns about the capacity of existing cyclotrons to supply the growing demand for radiotracers, given the significant increase in the volume of PET-CT exams and the installation of new PET-CT units, particularly at sites that do not have access to a local cyclotron. PET-CT at sites that rely on the shipment of radiotracers from larger centres, usually order twice the amount of radiotracers required to account for in-transit radiotracer decay because of the short half-life of radiotracers, thereby intensifying the demand for radiotracers.60
Artificial Intelligence
The current focus of AI in medical imaging departments in Canada is on assisting imaging professionals in image reconstruction, lowering radiation dose, and reading and interpreting images. AI is also used to a lesser extent for planning treatment, predicting outcomes, and carrying out administrative tasks. While its use is currently limited to just a few centres, our survey data show that AI has been implemented in clinical imaging as well as research practice. It is used across all advanced imaging modalities, and most of the use is with CT. AI is used in the imaging departments of hospitals in many provinces, with British Columbia being the jurisdiction that has incorporated it into clinical practice the most. Radiology departments that have embraced AI for one purpose tend to use it for other purposes as well. There may be other uses of AI in medical imaging that were not captured in our survey, particularly in the research setting.
It is anticipated that greater adoption of AI in Canada may hinge on the health care system’s ability to address several barriers to implementation.61 These barriers may include developing evidence standards as well as addressing concerns about cost, data reliance, training requirements, effects on clinicians, clinician-patient relationships, decision transparency, ethics, social implications, and privacy.62 It is believed that Canada may be well-positioned to play a leadership role internationally in the development and implementation of AI in this field.63
Teleradiology
Teleradiology is the “electronic transmission of diagnostic imaging studies from one location to another for the purposes of interpretation and/or consultation.”64 Teleradiology services have traditionally been used to overcome geographic boundaries for patients and physicians, to provide overnight coverage,65 and to help manage the increase in radiology workload.66
In Canada, domestic teleradiology services are common, with practices in eight jurisdictions, according to our data. Most of the work is conducted by radiologists located in the jurisdictions where the imaging studies originate. However, six jurisdictions use teleradiology services from other provinces, and one jurisdiction uses out-of-country services.
Within the context of COVID-19, there may be more demand for teleradiology, particularly where staff have been quarantined or are in short supply. The CAR recommends teleradiology services in the emergency setting in these instances.67
A potential barrier to the more extensive adoption of teleradiology services between provinces may be linked to regulatory requirements that are unique to each jurisdiction. In some jurisdictions, regulatory bodies do not permit radiologists to perform teleradiology work outside the province where the patient resides, even if they are licensed and accredited in that province.68 Other possible barriers to the further expansion of teleradiology in Canada are related to medico-legal issues, reimbursement, quality assurance, interoperability of systems, storage capacity, privacy, and security concerns.66
Exam-Ordering Privileges
In Canada, increasing costs in diagnostic imaging have previously been directly linked to increased access to imaging exams.69 For this reason, there is interest in the exam-ordering privileges of health care professions that do not have special training in diagnostic imaging.70
To determine exam-ordering privileges across Canada, jurisdictional validators were asked to provide information for clinical specialists, family physicians/general practitioners, and nurse practitioners for the imaging modalities addressed in this report. Most jurisdictions grant exam-ordering privileges to clinical specialists and family physicians/general practitioners for all imaging modalities, except PET-CT. Exam-ordering privileges are more restrictive for nurse practitioners in two provinces. For all modalities, there are exceptions to these rules, and, in some provinces, this depends on licensing and credentialing requirements.
Sensitivities around broadening ordering privileges to health care professionals who do not have formal training in radiation dose and appropriate utilization of imaging equipment may be based on the fact that gaps in this knowledge have previously contributed to the ineffective use of imaging resources.71 A Canadian study on radiation awareness72 investigated and compared the level of knowledge about radiation dose and the risks incurred from many imaging exams among radiology workers, including radiology residents, fellows, staff radiologists, and technologists. The study found that knowledge of radiation dose and risk is poor among all radiology workers, with more significant knowledge gaps among technologists compared with residents, fellows, and staff radiologists.72 Decision-makers may be concerned that professionals who lack specialized training in radiation protection may have larger gaps in knowledge than radiology workers and subsequently may be more likely to order exams that pose an unnecessary radiation threat to patients or are not medically necessary.71
In spite of these risks, there are also advantages to expanding exam-ordering privileges to a broader spectrum of health professionals.73 Improved patient health outcomes and significant long-term cost savings for the health system have been reported.73 As well, expanding exam-ordering privileges to nurse practitioners may be a mechanism to address shortages of family physicians,74 especially in rural and remote settings.75
Referring Physician Requisition Practices
This iteration of the CMII asked survey participants to report their requisition-ordering practices. Paper and fax are still the most widely used requisition methods across Canada, with most sites using this method for each type of imaging modality. Many sites report operating both paper and electronic order systems, with overall use across and within sites differing between modalities.
In Canada, automated order entry is used most commonly with MRI, and Alberta has a significantly higher adoption rate of this requisition system, compared to other jurisdictions. The benefits of automated patient order entry is well defined in the literature.76 The elimination of paper order forms and faxing shortens the requisition process,77 and helps to avoid delays, misinterpretations of orders, missing information, and misplaced or lost referrals.78 As well, automated order entry can be integrated into electronic medical records and decision support systems to improve patient and clinical care outcomes.79 Some important limitations to some automated order entry systems may have contributed to the residual use of paper referrals and to some health care professionals in Canada calling for the suspension of automated order entry systems.80 It is reported that unanticipated risks for patients81 have been caused by poor interface usability that can mislead users;81 forms are frequently incomplete or discordant compared to physicians’ notes; systems have idiosyncrasies that need to be fully understood before they can be optimized; and the performance of difference systems is highly variable.81 In addition, there are concerns that the use of both automated and paper entry may pose a risk to patient safety, as residual paper requisitions may be more likely to be missed or delayed as imaging staff focus on automated order entries as the primary source of orders.76
The survey also asked about the use of centralized booking services in imaging sites. Centralized booking identifies sites with underutilized imaging equipment, facilitating patient access to sites with lower wait times.8 Centralized order entry systems have been adopted in all provinces to varying extents, with the most use in MRI followed by CT. Newfoundland and Labrador has a higher adoption rate of centralized order entry than other jurisdictions.
Receiving requests by telephone is the least common ordering process across all modalities and all jurisdictions.
Appropriate Imaging and Radiation Safety
There is ongoing concern about potential health hazards associated with imaging exams that use radiation.31 Most of the emphasis is on CT exams, which account for most of the total radiation received by patients from any imaging modalities,31 although hybrid imaging modalities that use CT also contribute significantly to the radiation dose in individual patients.32 The combined dose from radiotherapy and associated imaging is another major contributor to cumulative patient radiation dose.82 Nearly half of Canadians are expected to receive a cancer diagnosis,83 and approximately 50% will be treated with radiotherapy.82 This indicates that the population of Canadians exposed to high target doses may be significant,82 and strategies to monitor cumulative radiation dose are warranted.84
Our survey indicates that 84% of facilities have a process in place for determining the appropriateness of imaging exams, an important means of reducing unnecessary exposure to radiation as part of diagnostic imaging. The most commonly used process to ensure appropriateness of exams is radiologist review of referral. Choosing Wisely Canada has played an important role in highlighting the need for appropriate imaging studies.10 As well, dose-management controls and unit recording of patient radiation dose per exam are widely used for imaging modalities that use ionizing radiation. Cumulative dose tracking has not been widely adopted in Canada, although most sites indicated plans to conduct cumulative dose tracking in the future. This suggests that knowledge of the risks and benefits of imaging for individual patients, particularly when the dose is high or the patient is sensitive to the effect of radiation, may not be well understood.84 A CAR Radiation Protection Working Group suggests that technologies to track cumulative dose may provide no clinical decision-making benefit and should be compared with other dose-reduction strategies.85 The working group suggests that diagnostic reference level methodologies, the completeness of patient-specific cumulative dose histories, accuracy of effective dose calculations, and the clinical utility of patient-specific histories should be considered before purchasing a tool for cumulative dose tracking.85
Peer Review
According to our data, approximately one-half to two-thirds of sites answered the question on conducting peer review of images. Our survey indicates that peer review is conducted across all jurisdictions and for all modalities, except SPECT. Alberta has the highest adoption rate of peer review programs, with 90% to 100% for CT, MRI, and the hybrid modalities. One province reported having no peer review programs in place.
Radiologists undertake peer review, often anonymously, in clinical practice as a means to provide ongoing feedback on performance, support learning from mistakes, improve standards, and identify gaps in education.86 In light of several highly publicized reviews that questioned the quality of radiologists’ work,87 more formalized peer review has been adopted as a quality assurance measure,88 and as a means to maintain the value of radiologists’ expertise.89
Some provincial and regional health ministries have implemented (or are implementing) specific peer review programs for radiology,89-92 and at least one province has set up a peer review program for all physicians.93 Three provinces collaborate through their respective licensing authorities and medical professional associations to provide peer review support for medical imaging,94 and some hospitals have implemented peer-review programs that are integrated into workstations.95
Canadian Data Compared With International Data
As of September 2020 (the latest date for which the OECD reported an international comparison), Canada appears in the lower tertile in terms of number of units per million people for CT, MRI, and PET-CT. Multiple countries have a similar number of units, and the accuracy of counting would affect a finer ranking.
As of 2020, Canada appeared below the median for the volume of CT, MRI, and PET-CT exams per thousand population. The number of CT exams per capita is highest in the US, followed by Iceland and Japan. The number of MRI examinations per capita is highest in Germany, Austria, US, France, Japan, and Iceland, all of which have more than 100 MRI exams per thousand population. The number of PET-CT exams per capita is highest in Denmark, followed by Belgium and France.
Over time, the growth in number of CT and MRI units per million and number of exams per thousand has exceeded population growth, with a levelling out of growth in recent periods (Table 82). Other countries appear to have had similar trends, so that Canada’s position relative to international comparators is not substantively different from other years when the comparisons are reported (CIHI [2007],19 CIHI [2012],38 CADTH [2015],20 CADTH [2017],21 CADTH [2020]), generally lying between the lower tertile and the median.
Table 82: Growth in Units and Exams Per Canadian Population, 2004 to 2019–2020
| Modality | Variable | 2004 | 2007 | 2012 | 2015 | 2017a | 2019–2020 |
|---|---|---|---|---|---|---|---|
| CT | Units per million | 9.5 | 12.1 | 9.5 | 15.1 | 15.3 | 15.5 |
| Exams per thousand | 87.1 | 103.3 | 125.5 | 147.0 | 153.3 | 143.4 | |
| MRI | Units per million | 3.6 | 6.1 | 8.9 | 9.5 | 10 | 10.2 |
| Exams per thousand | 24.2 | 31.2 | 49.3 | 54 | 50.7 | 61.6 |
a 2017 data were used in international comparison, as the latest set of international data available dated from 2018.
Source: CIHI (2007),19 CIHI (2012),38 CADTH (2015),20 CADTH (2017),21 CADTH (2020).
There is currently no international benchmark or guidance regarding the ideal number of imaging units per million population. There is a general assumption that too few units may lead to access problems in terms of geographic proximity and wait times, while too many may result in overuse.96
Limitations
Selection of Imaging Modalities
This iteration of the survey was restricted to six specialist imaging modalities; including others that are more common and widespread (for example, conventional X-ray radiography and ultrasonography) or that were included in earlier years of the survey (planar gamma cameras, angiography, and bone densitometry) would not have been feasible. This focus biases the coverage toward urban areas and does not capture alternative imaging options available outside these regions, especially in remote or rural areas, where patients need to travel or be transferred significant distances for imaging. In addition, these exclusions may limit understanding of the relationship among modalities within the health care system (for example, in pathways that involve multiple modalities) and consideration of funding allocation for diagnostic imaging across all modalities. We will consider including additional modalities in future iterations of the survey, as needs and technologies evolve, and conducting a survey by geography (i.e., focused on remote areas) rather than by modality.
Private Compared With Public Coverage
As participation in the survey was voluntary, and a definitive up-to-date list of facilities using medical imaging equipment in Canada was lacking, we cannot ensure that all facilities were contacted or represented. In particular, there was a notable difference in the representation of public and privately funded facilities, with more responses from the former. Publicly funded facilities were more readily identified than private facilities, as their data tend to be held at multiple administrative levels. Most provinces lack a publicly available repository of private imaging facilities. This may lead to underestimation of the number of units and of the total number of exams, particularly in jurisdictions where privately run imaging contributes to the overall use.
Variable Instrument Coverage
The quality and completeness of the data collected appear to be relatively high for CT and MRI compared with the other modalities. Both modalities are well-established and have seen longstanding use. For SPECT and SPECT-CT, data are more variable; for instance, several provinces reported combined SPECT and SPECT-CT exams, or reported a single total for nuclear medicine exams as a whole. It is possible that, in facilities with both a diagnostic imaging and a nuclear medicine department, we may have failed to reach the latter. With repeated iterations of the survey, we expect to extend our lists of contacts and obtain more specific information.
Reliability
The accuracy of the data in this report relies in part on the of survey participants’ personal knowledge of their particular health care setting. Level of insight and accuracy of estimates may vary substantially and lead to variability in the quality and completeness of reporting. Recall bias cannot be avoided, as we were unable to assess whether all information was visually verified and based on real data, or whether questions were answered from memory. Further, respondent fatigue may have affected the responses for difficult questions, such as those regarding the number of examinations or hours of use, particularly if real-time data were not recorded at the facilities.
Inconsistency in Data Sources
The data uploaded to the survey before opening it for responses were derived from several sources: unit technical specifications from the CMII 2012 dataset, and facility and technical responses from the 2017 CMII survey. Several rounds of data reconciliation were required to assemble the dataset and remove duplicate entries. Facility names required standardization to identify variations in names and trace name changes and restructuring. Units had to be matched across datasets using available data to avoid duplication, and involving interpretation of abbreviations and industry-specific terminology. Dates were variously reported as year of installation or first year of operation and frequently varied across datasets, leading to a one- or two-year uncertainty in the age of individual units, and a corresponding uncertainty in the means (depending on whether all the errors were in the same direction).
Sites varied in whether they considered certain units to be SPECT or SPECT-CT. Validator reporting of SPECT and SPECT-CT examinations was particularly variable, with combined reporting of SPECT and SPECT-CT exams for several provinces. This prevented us from being able to calculate the number of exams for individual modalities, including other nuclear medicine modalities, in the totals, inflating the results, and reporting only partial information for one province.
Effect of Missing Responses, Assumptions, and Imputations
The technical data for individual units were collected by CIHI for units installed before 2012 and by CADTH for units installed after 2012. This compilation included older units that had not been identified as having been decommissioned. Sites were asked to identify whether individual units had been decommissioned, but not all reviewed and updated their data, and, as a result, not all decommissioned units were identified. When counts were reconciled with validator data, we assumed the oldest surplus units of each modality had been decommissioned at each site. If this assumption were incorrect, it would affect the summaries of ages and technical specifications.
Use data (e.g., hours per day and per week) were not updated for all sites. We assumed that use data were unlikely to have changed for most sites, and hours per day, hours per week, and types of use were carried forward from 2017 when unavailable for 2019–2020. The data for the new questions concerning use were relatively sparse, and we do not know whether the responding sites were representative of all sites.
Future projections of imaging units and exams used a simple model based on 2019–2020 findings and population projected in five-year increments to 2040. The projection assumes that there would be no change in number of units or exams per population, which may not be appropriate, given the trends seen in previous iterations.
Future Directions and Next Steps
Future Directions for the CMII
In conducting future iterations of the CMII, we are considering the following:
- How can we capture the uptake of portable or bedside CT and MRI?
- How should we capture hardware upgrades to existing installations, which several respondents have remarked upon (in comments on the survey) and which can extend the usable lifespan of equipment substantially?
- How might we capture the impact of software upgrades on the currency of imaging equipment?
- How might we capture the eventual impact of AI, machine learning, and deep learning in terms of use of current equipment and requirements for adjunct equipment?
- How should we capture of availability and use for privately funded sites, which in some jurisdictions contribute significantly to overall imaging use?
- How should we determine whether the age profile of current units is appropriate to their level of use, as the data were not available to categorize levels of use and compare with age, as described by the CAR?
- How should we capture the installation of previously used equipment?
Policy, Research, and Clinical Practice Questions
Other questions have been provoked by developments in diagnostic imaging, health technology assessment, and the current medical imaging context in Canada.
- How might tracking of equipment through the entire life cycle enable planning for the replacement of equipment through the life cycle?
- The inventory of equipment might assist in planning the implementation of other therapies that depend on imaging (e.g., proton beam therapy requires a CT, MRI, and PET/CT scanner, and the inventory can identify where these already exist).
- How can the health care system improve access to imaging for patients in remote and rural areas?
- What role will AI play in medical imaging?
- Is there enough capacity to accommodate future radioisotope requirements?
- How does practice in remote and rural areas adapt to the lack of ready access to specialized diagnostic imaging?
- What is the cost-effectiveness of medical imaging technologies (taking into account wait times, clinical pathways, and clinical utility)?
- What is the regulatory framework in place to support public-private partnerships, specifically in terms of eligibility for private imaging (e.g., length of wait list) and proportion of public funding provided?
- How does legislation regarding diagnostic imaging differ across jurisdictions, and does that influence the way devices are distributed and used?
Conclusions and Implications of Findings
This report presents data on the number of units, their distribution, and their volume and type of use across Canada for six medical imaging modalities, as informed through a comprehensive survey and data-collection process, building on previous iterations of the survey by CADTH and others. It discusses changes over time, the age of units, technical characteristics, and Canada’s status compared with other countries.
The survey results provide insight into the current context of medical imaging across Canada. They raise relevant questions related to how medical imaging is monitored and regulated, and how it is optimally used. As well, they raise questions about how funding structures are organized, what the most cost-effective practices are, as well as whether access is equitable, especially in rural and remote areas. Overall, the findings of this report may help decision-makers identify gaps in service; inform medical imaging–related strategic planning on a national, provincial, or territorial basis; and help anticipate future growth and need for replacement. CADTH plans to explore the possibility of investigating some of these issues in the future.
Dernière mise à jour : 15 janvier 2021